Logging is an essential feature of an application to easily help us pinpoint or troubleshoot issues when a problem arises unexpectedly. .NET Core supports a logging API that works with a variety of built-in and third-party logging providers. In this post, we will take a look at how we can use Serilog to log data into different location based on Source Context and Levels.
What Serilog Is?
Taken from the official site:
Serilog provides diagnostic logging to files, the console, and elsewhere. It is easy to set up, has a clean API, and is portable between recent .NET platforms.
Unlike other logging libraries, Serilog is built with powerful structured event data in mind.
Creating An Empty ASP.NET Core Application
To demonstrate this exercise, we will create a simple ASP.NET Core Web Application. Let’s go ahead and fire up Visual Studio 2019. Create a new project and then select ASP.NET Core Web Application project with an Empty project template.
Visual Studio should scaffold a few default files: appsettings.json, appsettings.Development.json, Startup.cs and Program.cs. The default Program.cs file is typically going look like this:
namespace AspNetCoreSerilogDemo
{
    public class Program
    {
        public static void Main(string[] args)
        {
            CreateHostBuilder(args).Build().Run();
        }

        public static IHostBuilder CreateHostBuilder(string[] args)
           => Host.CreateDefaultBuilder(args)
                  .ConfigureWebHostDefaults(webBuilder =>
                  {
                      webBuilder.UseStartup<Startup>();
                  });
    }
}
The default ASP.NET Core project template calls Host.CreateDefaultBuilder(), which adds the following logging providers:
- Console
- Debug
- EventSource
- EventLog (only when running on Windows)
The default logging configuration can be found in both appsettings.json and appsettings.Development.json files:
{
  "Logging": {
    "LogLevel": {
      "Default": "Information",
      "Microsoft": "Warning",
      "Microsoft.Hosting.Lifetime": "Information"
    }
  }
}
Depending on which environment you are running, ASP.NET Core will load the necessary configuration file for you. As we can see, the default LogLevel is set to Information, which means that alot of data could be written in the Console. This is great during the development stage, but we should set the LogLevel to a higher severity level when deploying to production environment to avoid cluttering our logs with unnecessary information. In other words, to decrease the logging volume in production, we should set the LogLevel to Warning or Error level.
For the sole purpose of this demo, we will just stick to the default configuration with LogLevel set to Information.
In Startup.cs file, we can see the following code being generated within the Configure method:
public void Configure(IApplicationBuilder app,
                      IWebHostEnvironment env)
{
    if (env.IsDevelopment())
    {
        app.UseDeveloperExceptionPage();
    }

    app.UseRouting();

    app.UseEndpoints(endpoints =>
    {
        endpoints.MapGet("/", async context =>
        {
            await context.Response.WriteAsync("Hello World!");
        });
    });
}
The code above configure UseRouting(), UseDeveloperExceptionPage() and UseEndpoints() middleware. Running the code will simply displays the string “Hello World!” in the the browser. I won’t be covering the details and anatomy of Startup and Program classes in this post. For more information, I would recommend you heading over to the official documentation here: App startup in ASP.NET Core

Configure Default Logging
Let’s create a separate class that prints log data of the different events. The following is the complete code:
using Microsoft.AspNetCore.Http;
using Microsoft.Extensions.Logging;
using System.Threading.Tasks;

namespace AspNetCoreSerilogDemo
{
    public class TestLogApi
    {
        private readonly ILogger<TestLogApi> _logger;
        public TestLogApi(ILogger<TestLogApi> logger)
        {
            _logger = logger;
        }

        public async Task DumpLogs(HttpContext context)
        {
            _logger.LogInformation("This is a log with INFORMATION severity level.");
            _logger.LogWarning("This is a log with WARNING severity level.");
            _logger.LogError("This is a log with ERROR severity level.");
            _logger.LogCritical("This is a log with CRITICAL severity level.");

            await context.Response.WriteAsync("Events has been logged.");
        }
    }
}
Now let’s update our Configure method to add a new EndPoint for our test class:
public void Configure(IApplicationBuilder app,
                     IWebHostEnvironment env,
                     ILogger<TestLogApi> logger)
{
    if (env.IsDevelopment())
    {
        app.UseDeveloperExceptionPage();
    }

    app.UseRouting();

    app.UseEndpoints(endpoints =>
    {
        endpoints.MapGet("/", async context =>
        {
            await context.Response.WriteAsync("Hello World!");
        });

        endpoints.MapGet("/log", new TestLogApi(logger).DumpLogs);
    });
}
What we did was just adding a /log GET endpoint and delegate the request to our TestLogApi class and invoking the DumpLogs method.
Now when we run the code and navigate to /log in the browser, the code will result to something like this:
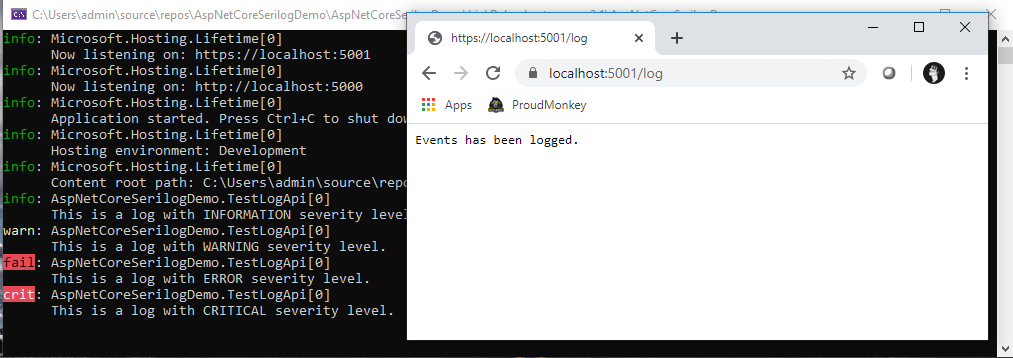
Great! We now have a logging in place within our application.
Configure Serilog
To leverage the features that Serilog offers, let’s integrate it within our application. First, we need to install the following Nuget package dependencies:
- Serilog.AspNetCore – Serilog integration dedicated for ASP.NET apps.
- Serilog.Settings.Configuration – A Serilog configuration provider that reads from Microsoft.Extensions.Configuration.
- Serilog.Filters.Expressions – Add support for Serilog Expression-based event filtering.
- Serilog.Sinks.Console – A Serilog sink that writes log events to the Windows Console or an ANSI terminal via standard output.
- Serilog.Sinks.File – A Serilog sink that writes log events to one or more text files.
Serilog provide various sinks that we can integrate for writing log events in storage in various formats. Either writing to Console, Files, Cloud, Databases, Email, Message Bus, you name it – the choice is yours!
For the simplicity of this demo, we will just use the Console and File sinks.
Now, let’s modify the appsettings.Development.json by replacing the Logging configuration with Serilog as shown in the following:
{
  "Serilog": {
    "MinimumLevel": {
      "Default": "Information",
      "Override": {
        "Default": "Information",
        "Microsoft": "Warning",
        "Microsoft.Hosting.Lifetime": "Information"
      }
    },
    "WriteTo": [
      { "Name": "Console" }
    ],
    "Enrich": [ "FromLogContext", "WithMachineName"],
    "Properties": {
      "Application": "AspNetCoreSerilogDemo"
    }
  }
}
The Serilog configuration above defines a name Console as a value for WriteTo attribute. This will instruct Serilog to write log data in the Console / Output Window in Visual Studio. You will also notice the Enrich and Properties attributes are being configured. For more information about Enrichers, see: Serilog Enrichment
Optionally, you can also remove the default Logging configuration section in appsettings.json as Serilog doesn’t reference it, leaving only the following setting:
{
  "AllowedHosts": "*"
}
Finally, let’s configure Serilog by modifying our Program.cs file to look something like this:
 public static IHostBuilder CreateHostBuilder(string[] args) =>
            Host.CreateDefaultBuilder(args)
                .ConfigureWebHostDefaults(webBuilder =>
                {
                    webBuilder.UseStartup<Startup>();
                })
                .UseSerilog((hostingContext, loggerConfig) =>
                    loggerConfig.ReadFrom
                    .Configuration(hostingContext.Configuration)
                );
Running the code will now result to something like this:
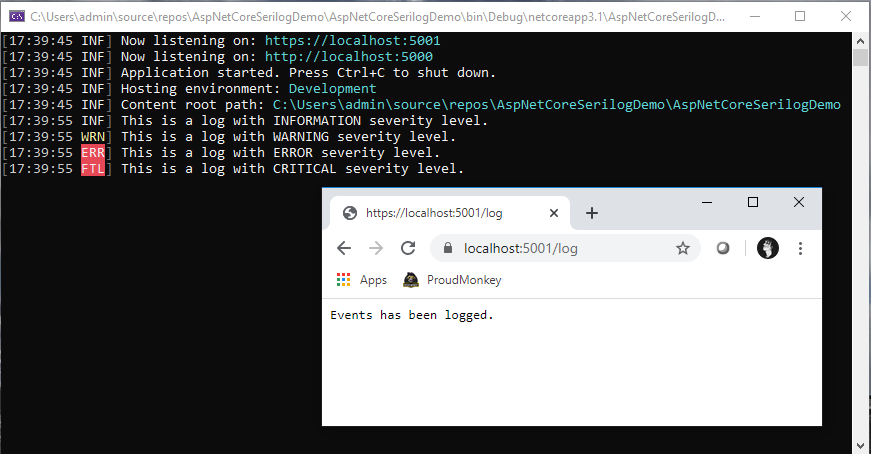
Notice how the log format and structure was changed compared to the default Logging in ASP.NET Core.
Now let’s make use of the Serilog.Sinks.File to dump our log data into a file. To do this, we simply need to change the configuration in our appsettings.Development.json file to this:
{
  "Serilog": {
    "MinimumLevel": {
      "Default": "Information",
      "Override": {
        "Default": "Information",
        "Microsoft": "Warning",
        "Microsoft.Hosting.Lifetime": "Information"
      }
    },
    "WriteTo": [
      { "Name": "Console" },
      {
        "Name": "File",
        "Args": {
          "path": "Logs/applog_.log",
          "outputTemplate": "{Timestamp:o} [{Level:u3}] ({SourceContext}) {Message}{NewLine}{Exception}",
          "rollingInterval": "Day",
          "retainedFileCountLimit": 7
        }
      }
    ],
    "Enrich": [ "FromLogContext", "WithMachineName"],
    "Properties": {
      "Application": "AspNetCoreSerilogDemo"
    }
  }
}
What we did there is just appending the File sink name as one of the value in WriteTo array and configure the Args attribute to control how we want to structure our log data in the file.
Running the code should automatically creates the folder called Logs and then writes the log within it based on the format that we set in outputTemplate attribute:
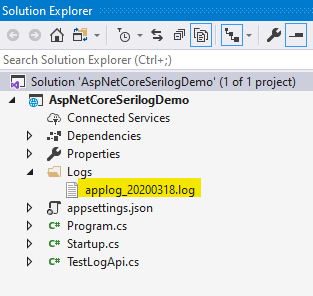
And here’s the generated output dumped into the file:
2020-03-18T17:54:50.9437995-05:00 [INF] (Microsoft.Hosting.Lifetime) Now listening on: "https://localhost:5001"
2020-03-18T17:54:50.9952468-05:00 [INF] (Microsoft.Hosting.Lifetime) Now listening on: "http://localhost:5000"
2020-03-18T17:54:50.9963669-05:00 [INF] (Microsoft.Hosting.Lifetime) Application started. Press Ctrl+C to shut down.
2020-03-18T17:54:50.9969413-05:00 [INF] (Microsoft.Hosting.Lifetime) Hosting environment: "Development"
2020-03-18T17:54:50.9988514-05:00 [INF] (Microsoft.Hosting.Lifetime) Content root path: "C:\Users\admin\source\repos\AspNetCoreSerilogDemo\AspNetCoreSerilogDemo"
2020-03-18T17:54:55.4900966-05:00 [INF] (AspNetCoreSerilogDemo.TestLogApi) This is a log with INFORMATION severity level.
2020-03-18T17:54:55.4932116-05:00 [WRN] (AspNetCoreSerilogDemo.TestLogApi) This is a log with WARNING severity level.
2020-03-18T17:54:55.4939016-05:00 [ERR] (AspNetCoreSerilogDemo.TestLogApi) This is a log with ERROR severity level.
2020-03-18T17:54:55.4946266-05:00 [FTL] (AspNetCoreSerilogDemo.TestLogApi) This is a log with CRITICAL severity level.
Splitting Log Data
In most cases, we would want to filter out the data that we only care about, or sometimes we would like to split error information out from normal logs. In this demo, we’ll take a look at how we can achieve them using FilterExpression.
Based on our previous example, the log outputs both data from Microsoft.Hosting.Lifetime and AspNetCoreSerilogDemo.TestLogApi source context. If we wanted to just log the data that comes from our TestLogApi class and separate the Information level from other levels, then we can modify our Serilog configuration to something like this:
{
  "Serilog": {
    "MinimumLevel": {
      "Default": "Information",
      "Override": {
        "Microsoft": "Warning",
        "System": "Warning",
        "System.Net.Http.HttpClient": "Warning"
      }
    },
    "WriteTo": [
      { "Name": "Console" },
      {
        "Name": "Logger",
        "Args": {
          "configureLogger": {
            "Filter": [
              {
                "Name": "ByIncludingOnly",
                "Args": {
                  "expression": "Contains(SourceContext, 'AspNetCoreSerilogDemo.TestLogApi') and (@Level = 'Error' or @Level = 'Fatal' or @Level = 'Warning')"
                }
              }
            ],
            "WriteTo": [
              {
                "Name": "File",
                "Args": {
                  "path": "Logs/Error/applog_.log",
                  "outputTemplate": "{Timestamp:o} [{Level:u3}] ({SourceContext}) {Message}{NewLine}{Exception}",
                  "rollingInterval": "Day",
                  "retainedFileCountLimit": 7
                }
              }
            ]
          }
        }
      },
      {
        "Name": "Logger",
        "Args": {
          "configureLogger": {
            "Filter": [
              {
                "Name": "ByIncludingOnly",
                "Args": {
                  "expression": "Contains(SourceContext, 'AspNetCoreSerilogDemo.TestLogApi') and @Level = 'Information'"
                }
              }
            ],
            "WriteTo": [
              {
                "Name": "File",
                "Args": {
                  "path": "Logs/Info/applog_.log",
                  "outputTemplate": "{Timestamp:o} [{Level:u3}] ({SourceContext}) {Message}{NewLine}{Exception}",
                  "rollingInterval": "Day",
                  "retainedFileCountLimit": 7
                }
              }
            ]
          }
        }
      }
    ],
    "Enrich": [ "FromLogContext", "WithMachineName"],
    "Properties": {
      "Application": "AspNetCoreSerilogDemo"
    }
  }
}
What we did in the configuration above is we created two sub Loggers: One for Error data and one for Information data. We then configure each logger to use the Filter attribute and then define the Name and Expression values. In this example, we’ve used the ByIncludingOnly as the name and then set the expression to:
"expression": "Contains(SourceContext, 'AspNetCoreSerilogDemo.TestLogApi') and @Level = 'Information'"
The expression above tells Serilog to write only to a specified file path when the SourceContext contains the value AspNetCoreSerilogDemo.TestLogApi and if the severity level is Information. The same thing as we did for dumping errors in the log file. For more information about Serilog Filter Expressions, see: Serilog Filters Expressions
Running the code will now filter our Console logs with log events that only comes from the TestLogApi class:
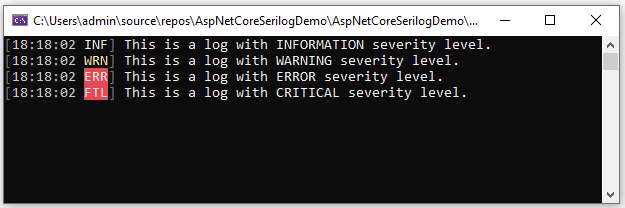
And our logs for Information and Errors is now separated as shown below:
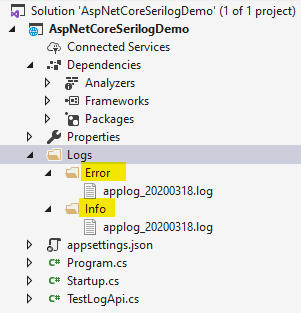
Here’s the generated output dumped into the Logs/Error/applog_20200318.log file:
2020-03-18T18:21:34.8228472-05:00 [WRN] (AspNetCoreSerilogDemo.TestLogApi) This is a log with WARNING severity level.
2020-03-18T18:21:34.8301949-05:00 [ERR] (AspNetCoreSerilogDemo.TestLogApi) This is a log with ERROR severity level.
2020-03-18T18:21:34.8322773-05:00 [FTL] (AspNetCoreSerilogDemo.TestLogApi) This is a log with CRITICAL severity level.
And here’s the generated output dumped into the Logs/Info/applog_20200318.log file:
2020-03-18T18:21:34.7640144-05:00 [INF] (AspNetCoreSerilogDemo.TestLogApi) This is a log with INFORMATION severity level.
Done! I hope you enjoy this reading!

Andriy Kravets is writer and experience .NET developer and like .NET for regular development. He likes to build cross-platform libraries/software with .NET.