Application troubleshooting is never enjoyable. We would much rather be developing new software for an exciting project. We will discuss some troubleshooting advice in this article for ASP.NET web applications.
Are You Getting Many Erros on Your ASP.NET Application?
The common issue is 503 error message. If your IIS Application Pool is not running, all requests will return 503 errors. Your IIS Application Pool may occasionally enter a stopped state as a result of w3wp crashing, configuration issues, or other strange circumstances.
Ensure that the IIS Application Pool is configured to start. For more information, you may read our above article about how to fix 503 error message. Now, we back to main issue why your ASP.NET application throw many error message?
Do 500 Internal Server Errors or Exceptions Occur on Every Page Load?
To solve this issue, you need to quickly check your error logs. Depending on the issue and how you are doing exception logging, it might be getting logged to a file or your error tracking tool. You may also want to check Windows Event Viewer if you can gain access to it.
If every page load throws an exception, you likely have a configuration problem in your Web.config or ApplicationHost.config. You could also have problems with your ASP.NET session provider, caching, or other application dependencies that are used on every single web request.
You might encounter exceptions on each page load, for instance, if your ASP.NET Session provider is Redis or SQL Server and they are unavailable. A PageOutput cache provider may experience a comparable problem.
You are probably unable to see the details of an exception that your application is throwing when a page loads. This makes ASP.NET issues difficult to troubleshoot. You most likely see your personal error page or the default ASP.NET error page (also known as the “yellow screen of death”).
You could make ASP.NET display the complete exception details while you temporarily disable your custom error page. Please be aware that this may display information that could be sensitive. But if your application is down and you need a quick fix, this might be useful.
Things to do if Your ASP.NET Apps Working Slowly
There could be a few common issues if your ASP.NET web application is up and running but is running slowly overall. such as a spike in traffic or an issue with an application dependency (such as SQL Server, Redis, etc.). Let’s go over how to fix issues with these ASP.NET web applications.
Your server’s CPU may be capped.
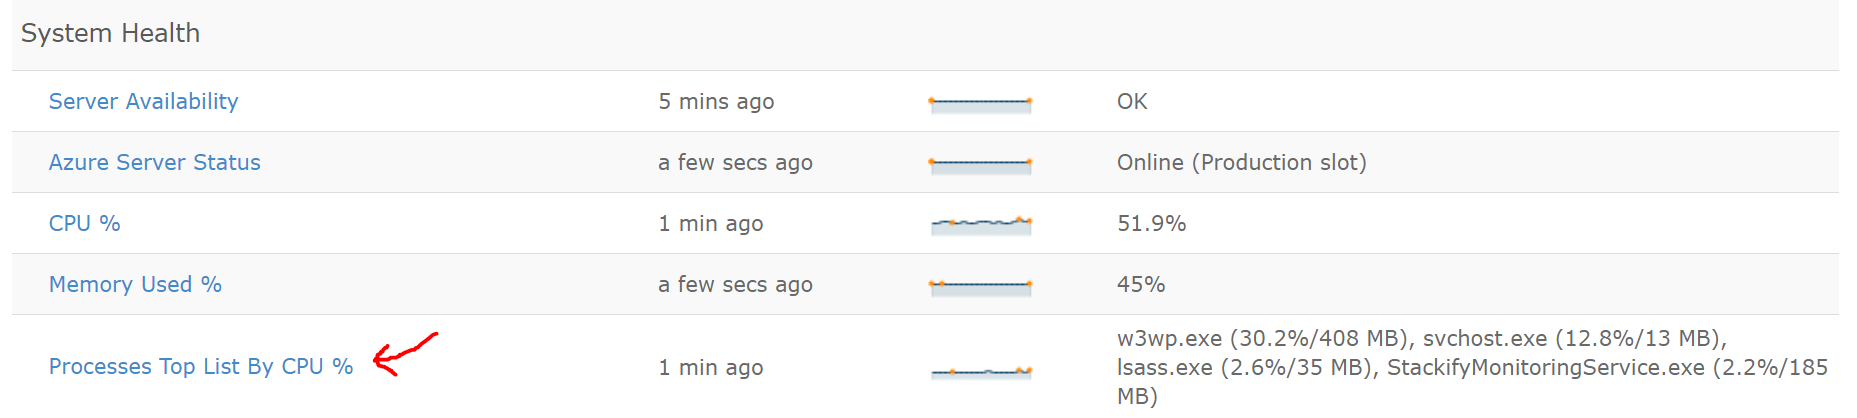
Your application will run slowly if the server CPU is running at 100%. You must determine whether your application is taking up the entire CPU or if there is another activity going on.
Throughout my career, I have encountered issues where a backup service, Windows Update, or antivirus program was running and killing the server CPU.
Verify that nothing is obstructing your application. You may be able to see which applications are using the CPU through your server monitoring tool, or you may need to remote desktop into the server to confirm the CPU usage.
Look for Application Exceptions
When trying to pinpoint issues with an application, developers frequently turn to exceptions as their first line of defense. Adopting sound C# exception handling best practices is something I strongly advise. Look through your log files, error tracking software, or even Windows Event Viewer for any exceptions that might be connected to your application issue.
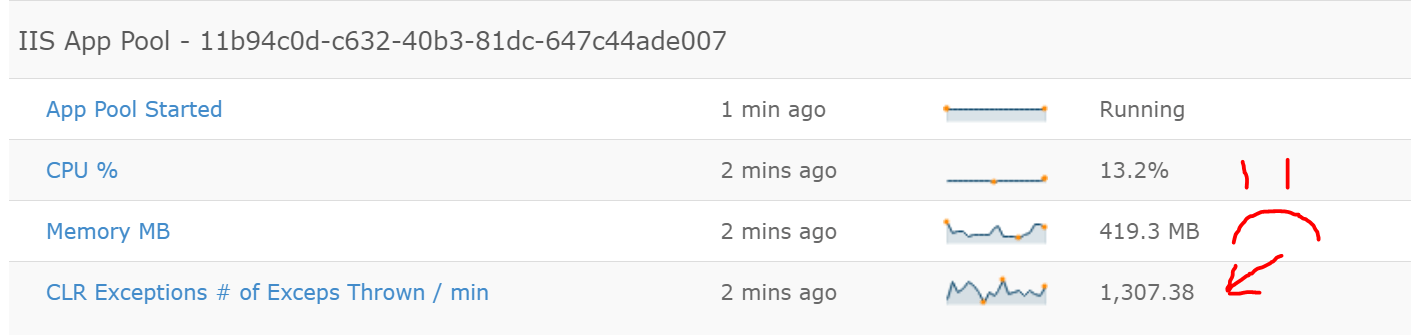
Another excellent suggestion is to look for.NET exceptions in Windows Performance Counters. One excellent metric to constantly watch is “CLR Exceptions # Exceps Thrown / Sec”. The performance counter will inform you of the number of exceptions even if you are unable to see them.
Exceptions can undoubtedly signal application issues, and even hidden exceptions occurring frequently can increase CPU usage.
You can see that this application is throwing 1,307 exceptions every minute in the example below.
How are the Performance of Your Application Dependencies?
The majority of modern applications rely on numerous other applications. Your applications performance may be adversely affected immediately if any of these are down or performing poorly.
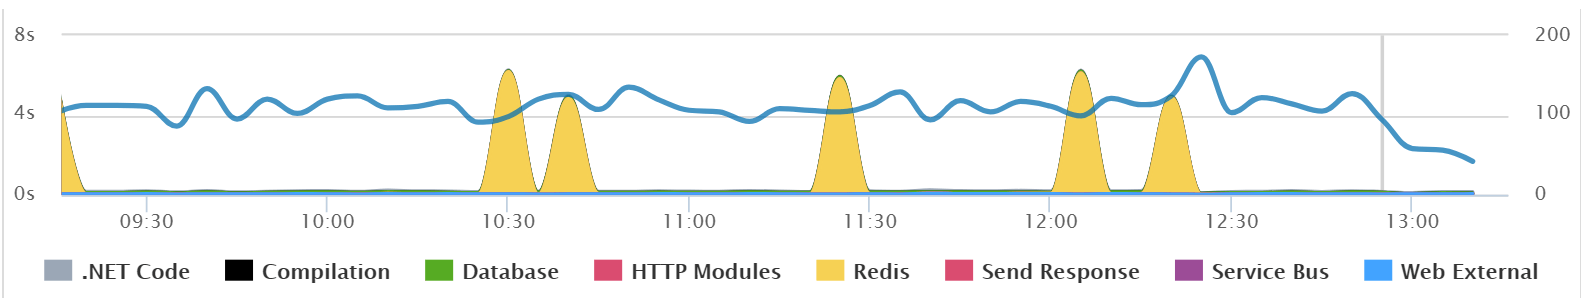
For example, we use Retrace, is shown in the screenshot below. Retrace’s automatic performance monitoring of your application dependencies is one of its best features.
The sample application (illustrated below) has trouble connecting to Redis on occasion. The graph below makes it crystal clear that Redis is the source of performance issues. Retrace displays the precise exceptions as well as the web requests that are being impacted.
Check Your Top Web Request
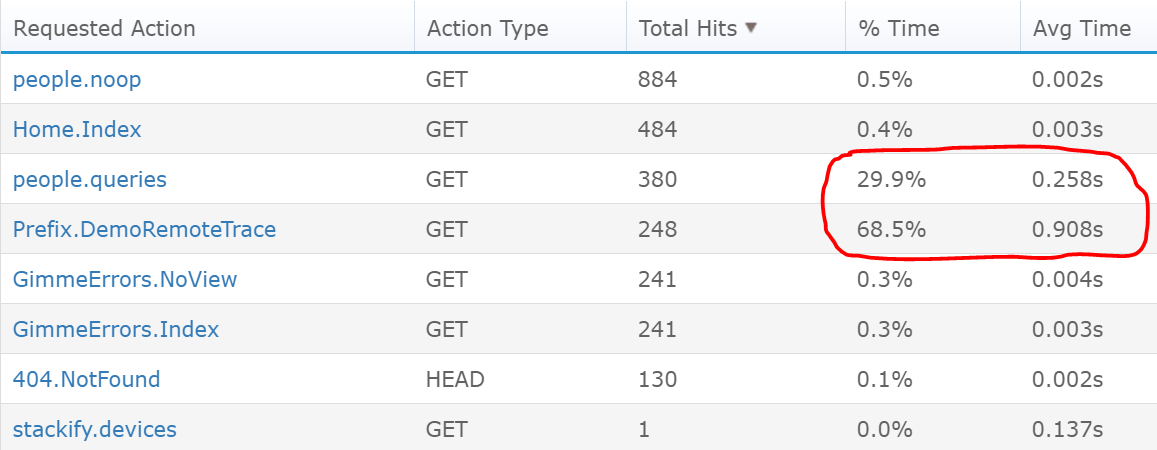
You should review your most popular web requests as part of the troubleshooting process for your ASP.NET performance issues. You’re interested in finding out which requests take the longest to complete and which get called the most frequently.
Your top 5 web requests can be tracked visually with Retrace. It is very useful when one particular request consumes a significant portion of the total time. The previous Redis example is repeated here. This particular web request requires a lot of time when connecting to Redis because of performance issues.
When you go through all of your requests, there might be some that come in frequently but move very quickly. There may be some other instances that occur less frequently but take the most time overall.
How to Identify Spikes in Traffic
Several Windows Performance Counters are offered by IIS and ASP.NET and are useful for calculating web server traffic. With your application monitoring tool, you should always keep an eye on these. Retrace automatically monitors a number of them and is always accessible to you.
You might also be able to see how many requests per minute your application is serving if you use an APM solution like Retrace. They make use of lightweight code profiling, which keeps track of each web request made through your web application.
You can use your IIS logs to determine whether traffic patterns have changed if you didn’t have monitoring in place before performance started to decline. On your web servers, you can find your IIS logs, which typically contain a few hours or days’ worth of data. To track the number of requests made over time by the hour or minute, you can use a free tool like Log Parser Studio.
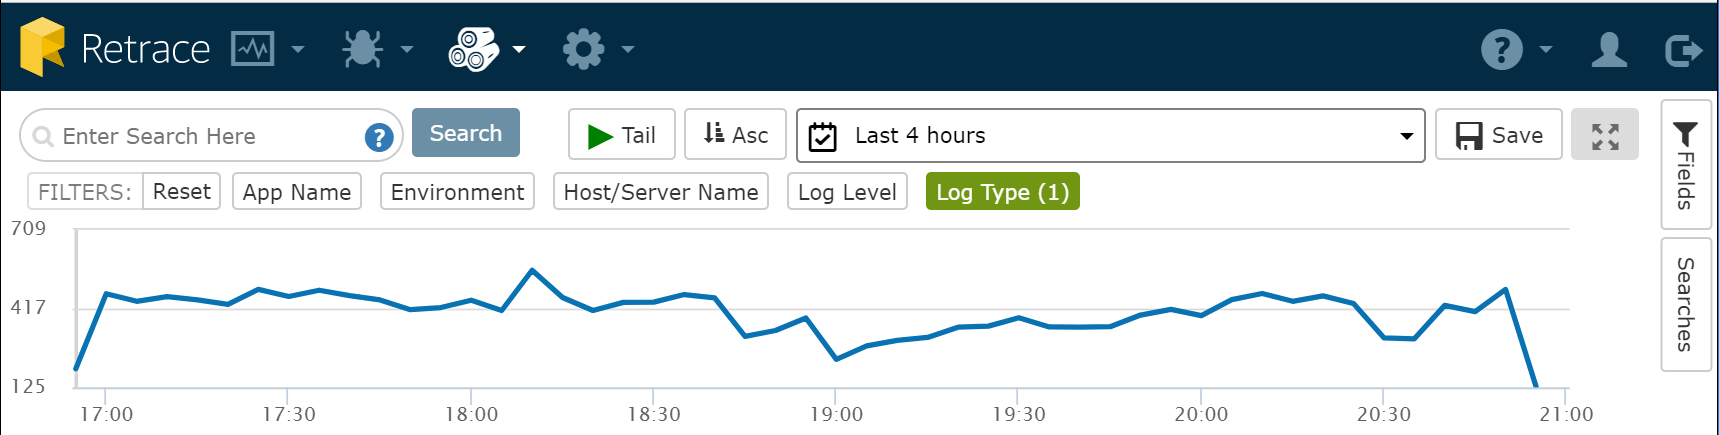
Your IIS and application logs can be searched for and visualized with Retrace’s built-in log management functionality. The IIS logging rate over time for an application is shown in the graph below.
What is the IIS Worker Process Doing?
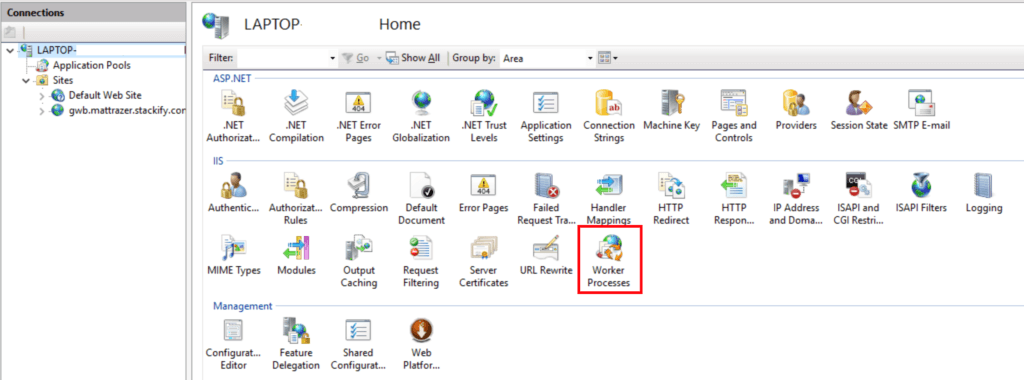
Check the live requests within IIS if you are unsure of what is causing your performance issues. Worker Processes can be selected from the IIS Management Console.
Right click on your running application pool and select “View Current Requests”.
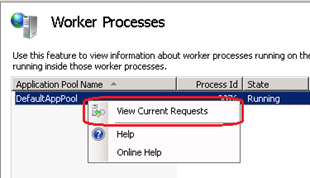
This will bring up a list of the currently running ASP.NET web requests as shown below.
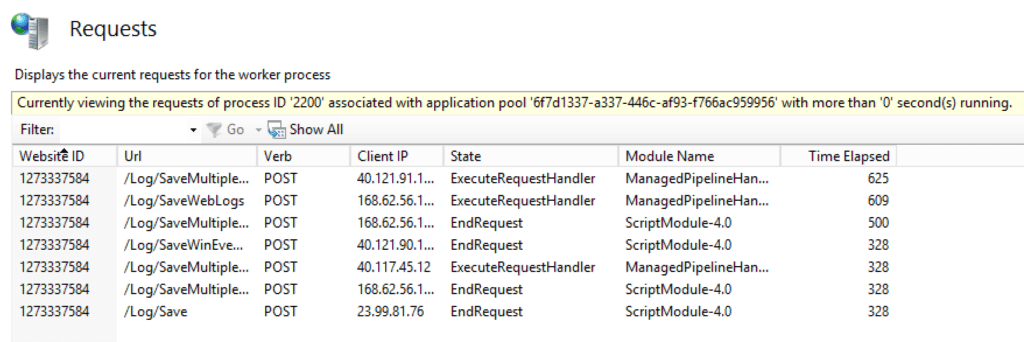
I’d advise checking the “Time Elapsed” to see if there are any requests that are taking particularly long. Check to see if they are all trapped in the same module as well. This may be an indication that the problem is entirely with ASP.NET Sessions or another phase of the ASP.NET request lifecycle. The issue may also be traced to a specific URL, which you can then pinpoint.
How to Fix Particular ASP.NET Web Request Issues
Up until now, our attention has been on how to fix issues with ASP.NET web applications that affected the entire website. You are probably troubleshooting a specific web request the majority of the time.
You most likely are experiencing one of the following three issues:
- An error is being thrown by a web request.
- Web requests are extremely slow.
- A logic issue is preventing a web request from working properly.
We will go over some advice for dealing with each of those three situations.
View Your Application Log
Your application logs can be of great assistance at any time when you are trying to solve an application-related issue. Most developers would likely respond with “Send me the logs!” as their first command. Using a logging framework like NLog, log4net, or Serilog is something I would strongly advise. Then, to make it simpler to search them across various servers, you can send them to a log management service.
It’s very helpful to search and tail your application logs when troubleshooting production issues. As you attempt to replicate a problem, you can use a log management tool to view your logs in real time.
Are Exceptions Being Thrown by the Web Request?
You should look for exceptions in your server-side logs if a 500 Internal Server Error is being returned by your web request. It is crucial to have effective exception handling in place and properly log all of your errors, as was previously mentioned in relation to application logs generally. Then, you can send each exception to an error tracking service like Retrace.
Check Your SQL Server Database or Other Web Services
There might be a problem with your web request if it depends on SQL Server, Elasticsearch, or another application. This also includes any HTTP web services from third parties that your code may call. If one of the microservices used by an application is slow or unavailable, it will cause issues.
If these dependencies are throwing exceptions, that is the easiest way to tell if there are issues with them. If they aren’t, you might need to profile your code with an APM tool like Retrace so you can see what it is doing.
How to Fix Issues with Application Logic
The most challenging issues to solve involve your code acting “weird” or failing to perform as it should. One of the most crucial resources you have to solve issues of this nature is application logging.
Another option is remote debugging, but this might cause additional performance issues. Microsoft offers a variety of tools, including remote debugging for Visual Studio, Intellitrace, and the Snapshot Debugger for exceptions.
Transaction Profiling Facilitates Simple Troubleshooting
Any ASP.NET web application issue can be solved using lightweight code profiling. It can actually retrace what your code is doing, which is why we named it Retrace.
When it comes to troubleshooting issues with ASP.NET web applications, the transaction traces that we gather result in very little application overhead.
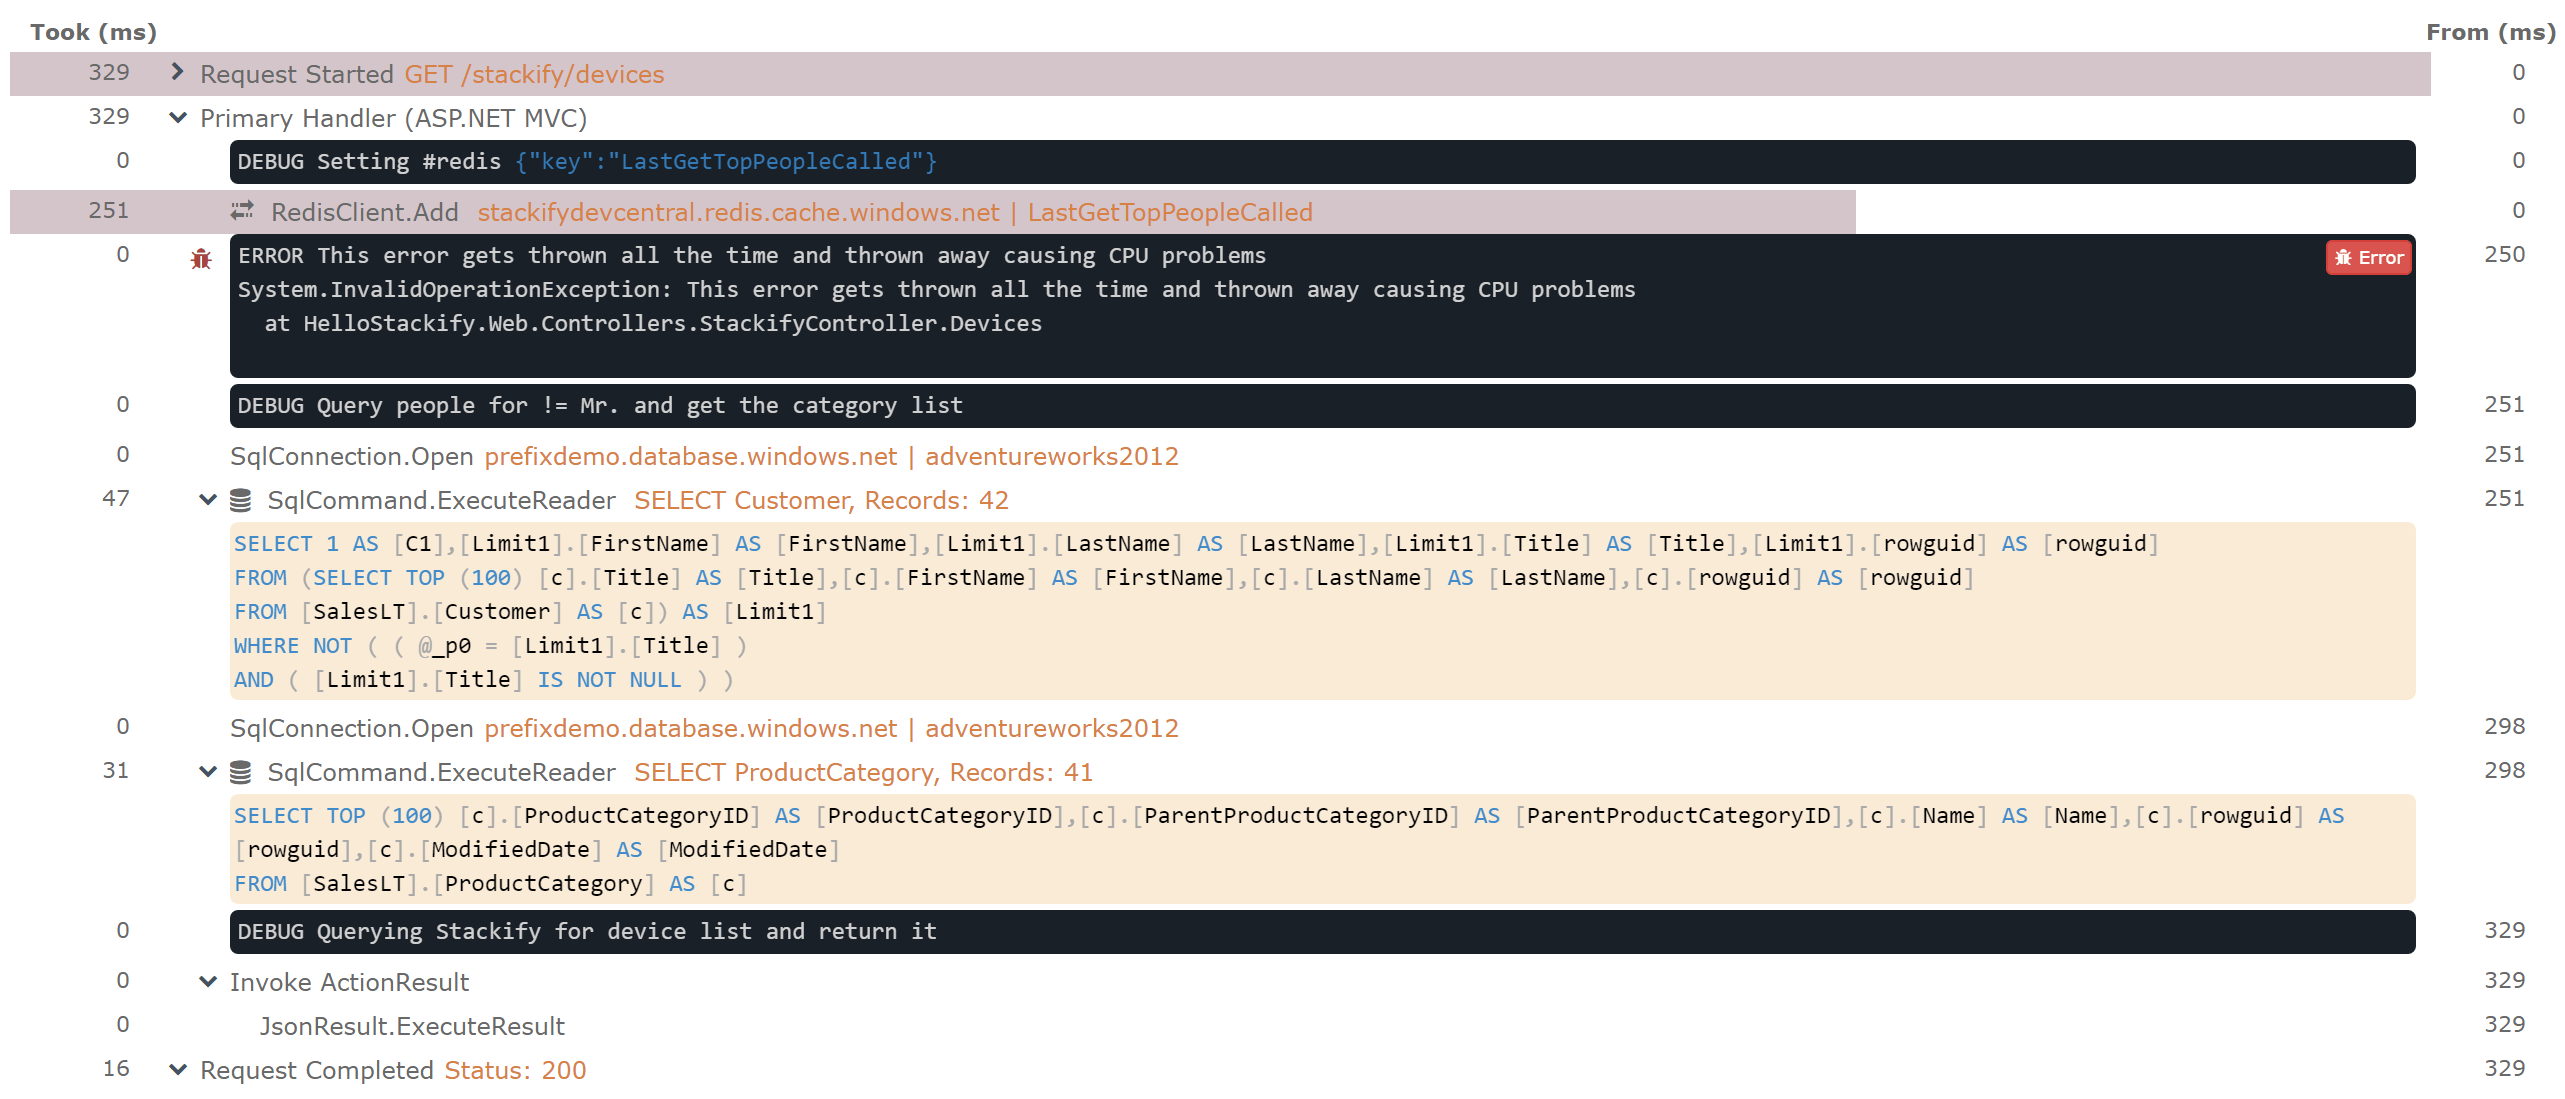
Below is an illustration of the different kinds of traces that Retrace gathers. In the context of a specific web request, it enables you to view your errors, logs, SQL statements, and much more.
Summary
In this guide, we reviewed how to troubleshoot ASP.NET web application problems. Including problems that may be affecting your entire application as well as specific web requests.
Are you looking for an affordable and reliable Asp.net core hosting solution?
Get your ASP.NET hosting as low as $1.00/month with ASPHostPortal. Our fully featured hosting already includes
- Easy setup
- 24/7/365 technical support
- Top level speed and security
- Super cache server performance to increase your website speed
- Top 9 data centers across the world that you can choose.


Javier is Content Specialist and also .NET developer. He writes helpful guides and articles, assist with other marketing and .NET community work