Since web APIs and microservices have become so common, it is essential to keep track of their health. However, when working with multiple APIs at once, this task can be very difficult. However, some characteristics—health checks—allow us to create checks quickly and precisely.
What Are Health Checks in ASP.NET Core?
The middleware and libraries offered by ASP.NET Core include health checks to aid in reporting the condition of the application infrastructure components.
Why Are Health Checks Required?
Because we can easily and directly use them to monitor an application’s operation in real time.
How Do Health Exams Operate?
We use a health check to verify the status of a service and its dependencies through an endpoint in the API of the REST service in order to determine whether an API is functioning normally or not.
This enables us to quickly and uniformly determine whether the service or our dependencies are down.
This endpoint makes use of a different service that evaluates the dependencies on it as well as the state of the rest of the system’s functionality.
Performance evaluations, runtime statistics, and connections to other downstream services are just a few of the data points gathered during the check. Depending on how well the services in the health check performed, an HTTP code and a JSON object are returned after the evaluation is complete.
Now that we know the basics about health checks, we can implement an example and see in practice how it works.
Create the Project
Give the command below after opening a PowerShell console in the folder where you want to create the project. With the name “HealthCheck,” this command will create an ASP.NET 5 Web API project. You can use Visual Studio to open the “HealthCheck.csproj” file after it has been created.
dotnet new webapi -n HealthCheck --framework net5.0
Then create a new controller named “HealthController” and add the following code:
services.AddHealthChecks();
You can now launch the application and see the newly created /health route. To make the request, use Fiddler as shown in the image below:
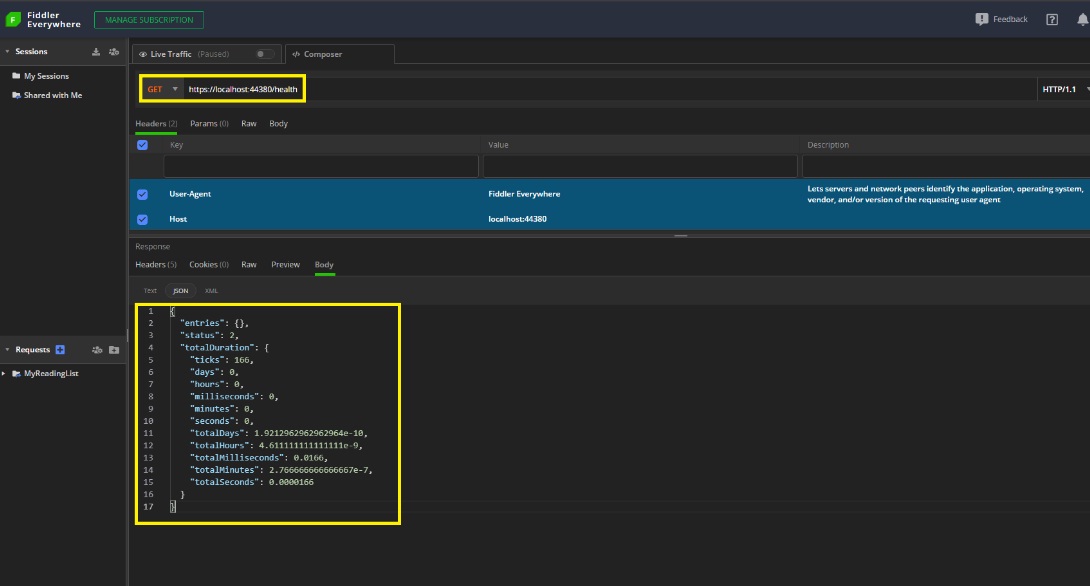
The application returned a JSON object with the following details when we sent a request to the /health route:
Entries: A dictionary-type object in this case is empty.
Status: 2 – Derives from the “HealthStatus” enum and as the summary means: “Indicates that the health check determined that the component was healthy.”
TotalDuration: Health Check runtime information.
In simple terms, our API is “healthy”—no problems were found and we now have a route just to check this. 🎉
Database health check
We can examine other fundamental aspects of the application, such as the connection to a database, in addition to its integrity.
Redis will be used as the database in this instance. You must have it running directly or within a Docker image on your computer. Change the connection string to use any other database if you’d like.
Installing “AspNetCore.HealthChecks.Redis” – Version=”5.0.2″ is necessary to achieve this.
You can install it in the project with NugetPackage or from the console with the command:
dotnet add package AspNetCore.HealthChecks.Redis
Let’s now create a “Helper” class where we will store the Redis connection string. Then in the project, make a folder called “Helpers” and place the following code in a static class called “UtilsHelpers”:
public static string GetConnectionString()
{
return "localhost:6379";
}
Add the method in charge of confirming the Redis connection to the “Startup.cs” file. The connection string we just made will be used.
Consequently, the Startup’s “ConfigureServices” method ought to appear as follows:
public void ConfigureServices(IServiceCollection services)
       {
           //Here is HealthCheck and the connection to Redis
           services.AddHealthChecks()
               .AddRedis(redisConnectionString: UtilsHelpers.GetConnectionString(), name: "Redis instance");

           services.AddControllers();
           services.AddSwaggerGen(c =>
           {
               c.SwaggerDoc("v1", new OpenApiInfo { Title = "HealthCheck", Version = "v1" });
           });
       }
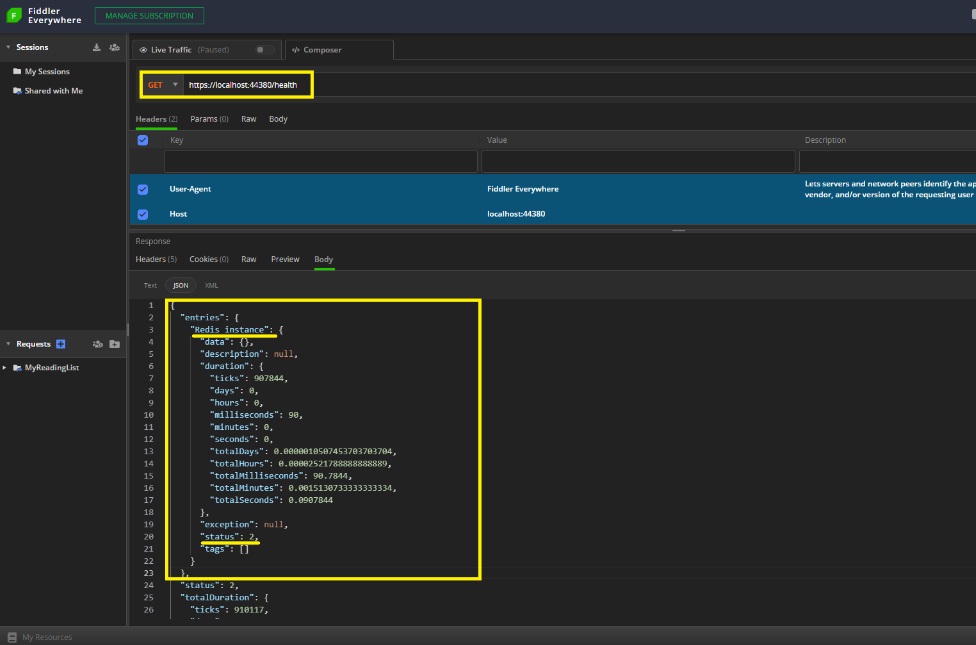
If your connection to Redis or another database you’ve used is stable, Fiddler will return the following response, which will display details about the connection:
HealthCheck Through a Graphical Interface
The graphical interface with a sort of entertaining dashboard that the ASP.NET Core health checks offer is another intriguing feature that allows us to view the events that occurred during the checks and the history of the entire execution.
Let’s try it out and see how it works. To do that, we must add the following project dependencies:
- AspNetCore.HealthChecks.UI
- AspNetCore.HealthChecks.UI.Client
- AspNetCore.HealthChecks.UI.InMemory.Storage
The configurations of the libraries we recently installed in the project will now be added during “Startup” of the project. The method “ConfigureServices” will then be replaced with the one below. The duties of each configuration are visible in the comments.
public void ConfigureServices(IServiceCollection services)
{
    //Here is HealthCheck and the connection to Redis
    services.AddHealthChecks()
        .AddRedis(redisConnectionString: UtilsHelpers.GetConnectionString(), name: "Redis instance");

    services.AddControllers();
    services.AddSwaggerGen(c =>
    {
        c.SwaggerDoc("v1", new OpenApiInfo { Title = "HealthCheck", Version = "v1" });
    });

    // Here is the GUI setup and history storage
    services.AddHealthChecksUI(options =>
    {
        options.SetEvaluationTimeInSeconds(5); //Sets the time interval in which HealthCheck will be triggered
        options.MaximumHistoryEntriesPerEndpoint(10); //Sets the maximum number of records displayed in history
        options.AddHealthCheckEndpoint("Health Checks API", "/health"); //Sets the Health Check endpoint
    }).AddInMemoryStorage(); //Here is the memory bank configuration
}
And the “Configure” method replace it with this:
public void Configure(IApplicationBuilder app, IWebHostEnvironment env)
        {
            if (env.IsDevelopment())
            {
                app.UseDeveloperExceptionPage();
                app.UseSwagger();
                app.UseSwaggerUI(c => c.SwaggerEndpoint("/swagger/v1/swagger.json", "HealthCheck v1"));
            }

            app.UseHttpsRedirection();

            app.UseRouting();

            app.UseAuthorization();

            app.UseEndpoints(endpoints =>
            {
                endpoints.MapControllers();

                //Sets the health endpoint
                endpoints.MapHealthChecks("/health");
            });

            //Sets Health Check dashboard options
            app.UseHealthChecks("/health", new HealthCheckOptions
            {
                Predicate = p => true,
                ResponseWriter = UIResponseWriter.WriteHealthCheckUIResponse
            });

            //Sets the Health Check dashboard configuration
            app.UseHealthChecksUI(options => { options.UIPath = "/dashboard"; });
        }
Our dashboard is almost ready to work. Now, in the “UtilsHelpers” class, add the following method:
public static string ToJSON(this object @object) => JsonConvert.SerializeObject(@object, Formatting.None);
Important! To use the “SerializeObject” method, you need to install “Newtonsoft.Json” – Version=“13.0.1” as dependency.
And now, in the “HealthController” replace the “Get” method with this:
[HttpGet]
public async Task<IActionResult> Get()
{
    var report = await _service.CheckHealthAsync();
    var reportToJson = report.ToJSON();

    _logger.LogInformation($"Get Health Information: {reportToJson}");

    return report.Status == HealthStatus.Healthy ? Ok(reportToJson) : StatusCode((int)HttpStatusCode.ServiceUnavailable, reportToJson);
}
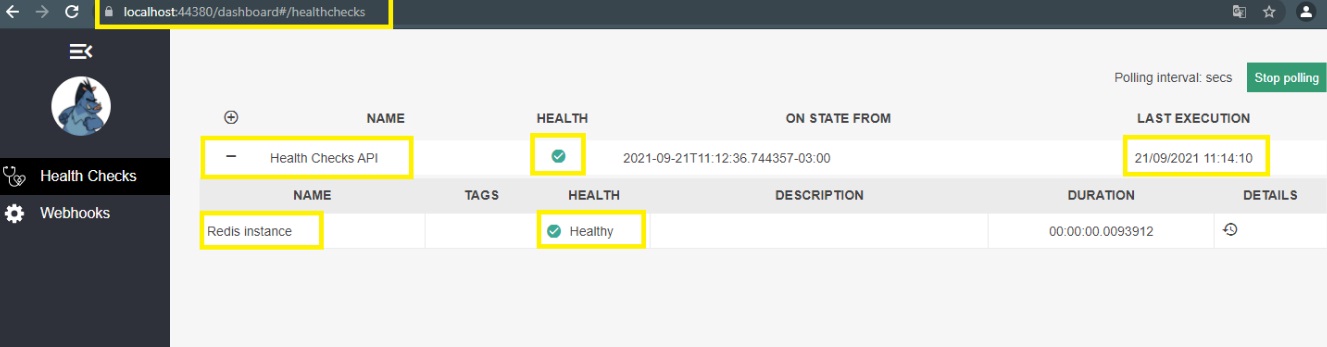
Finally, our dashboard is visible. Start the application and navigate to “localhost:PORT/dashboard” to do that. If you completed all the previous steps, you will see this lovely dashboard with the verification data in your browser:
Customizing the Checks
Customizing the checks and selecting how we want the results to be returned is an intriguing feature.
To do this, a class that inherits the “IHealthCheck” interface must be created. Then make a folder called “Custom” and put the following code inside it in a class called “CustomHealthChecks”:
using Microsoft.Extensions.Diagnostics.HealthChecks;
using System;
using System.Net;
using System.Net.Http;
using System.Threading;
using System.Threading.Tasks;

namespace HealthCheck.Custom
{
    public class CustomHealthChecks : IHealthCheck
    {
        public async Task<HealthCheckResult> CheckHealthAsync(HealthCheckContext context, CancellationToken cancellationToken = default)
        {
            var catUrl = "https://http.cat/401";

            var client = new HttpClient();

            client.BaseAddress = new Uri(catUrl);

            HttpResponseMessage response = await client.GetAsync("");

            return response.StatusCode == HttpStatusCode.OK ?
                await Task.FromResult(new HealthCheckResult(
                      status: HealthStatus.Healthy,
                      description: "The API is healthy (。^▽^)")) :
                await Task.FromResult(new HealthCheckResult(
                      status: HealthStatus.Unhealthy,
                      description: "The API is sick (‘﹏*๑)"));
        }
    }
}
We are developing a method in this class that queries a “cat” API and returns the outcome along with a humorous Kaomoji.
But the class dependency injection still needs to be completed.
The “ConfigureServices” method should appear as follows because we’re going to add the check in the class right after the Redis check at startup:
public void ConfigureServices(IServiceCollection services)
{
//Here is HealthCheck and the connection to Redis
services.AddHealthChecks()
.AddRedis(redisConnectionString: UtilsHelpers.GetConnectionString(), name: "Redis instance")
.AddCheck<CustomHealthChecks>("Custom Health Checks"); //Here is the custom class dependency injection
services.AddControllers();
services.AddSwaggerGen(c =>
{
c.SwaggerDoc("v1", new OpenApiInfo { Title = "HealthCheck", Version = "v1" });
});
// Here is the GUI setup and history storage
services.AddHealthChecksUI(options =>
{
options.SetEvaluationTimeInSeconds(5); //Sets the time interval in which HealthCheck will be triggered
options.MaximumHistoryEntriesPerEndpoint(10); //Sets the maximum number of records displayed in history
options.AddHealthCheckEndpoint("Health Checks API", "/health"); //Sets the Health Check endpoint
}).AddInMemoryStorage(); //Here is the memory bank configuration
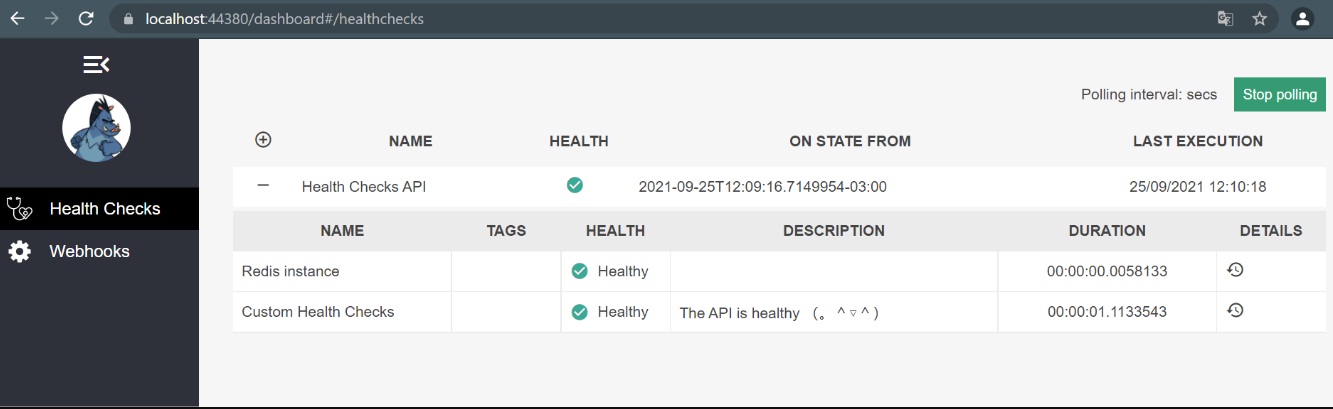
}Now we can start the application again and we will have the following result in the dashboard:
Conclusion
In this article, we learned the value of performing a health check on our APIs and how to do so quickly and easily using health check resources. We also learned how to customize the results and use the dashboard’s graphical user interface.
I hope you find this article useful as you design your health checks!
Get your ASP.NET hosting with FREE SSL certificate with ASPHostPortal. Our fully featured hosting already includes
- Easy setup
- 24/7/365 technical support
- Top level speed and security
- Super cache server performance to increase your website speed
- Top 9 data centers across the world that you can choose.


Andriy Kravets is writer and experience .NET developer and like .NET for regular development. He likes to build cross-platform libraries/software with .NET.