Sometimes, it is bit annoying to know that 1 or 2 databases can utilize high SQL usage on the server and it impact to your server performance. A large percentage of the memory your SQL Server instance utilizes is consumed by buffer pool (essentially, data). In this tutorial, we will trying to help you to identify databases that consume the most buffer pool memory which objects within those databases.
How to Find Database that Eat High Resources?
A Dynamic Management View (DMV) introduced in SQL Server, called sys.dm_os_buffer_descriptors, contains a row for every page that has been cached in the buffer pool. Using this DMV, you can quickly determine which database(s) are utilizing the majority of your buffer pool memory. Once you have identified the databases that are occupying much of the buffer pool, you can drill into them individually. In the following query, I first find out exactly how big the buffer pool currently is (from the DMV sys.dm_os_performance_counters), allowing me to calculate the percentage of the buffer pool being used by each database:
-- Note: querying sys.dm_os_buffer_descriptors
-- requires the VIEW_SERVER_STATE permission.

DECLARE @total_buffer INT;

SELECT @total_buffer = cntr_value
FROM sys.dm_os_performance_counters
WHERE RTRIM([object_name]) LIKE '%Buffer Manager'
AND counter_name = 'Database Pages';

;WITH src AS
(
  SELECT
  database_id, db_buffer_pages = COUNT_BIG(*)
  FROM sys.dm_os_buffer_descriptors
  --WHERE database_id BETWEEN 5 AND 32766
  GROUP BY database_id
)
SELECT
[db_name] = CASE [database_id] WHEN 32767
THEN 'Resource DB'
ELSE DB_NAME([database_id]) END,
db_buffer_pages,
db_buffer_MB = db_buffer_pages / 128,
db_buffer_percent = CONVERT(DECIMAL(6,3),
db_buffer_pages * 100.0 / @total_buffer)
FROM src
ORDER BY db_buffer_MB DESC;
In the above query, I’ve included the system databases, but you can exclude them by uncommenting the WHERE clause within the CTE. Note that the actual filter may need to change with future versions of SQL Server; for example, in SQL Server 2012, there is a new database for Integration Services called SSISDB. You may want to keep an eye on system databases just to have a complete picture, seeing as there isn’t much you can do about their buffer pool usage anyway – unless you are using master or msdb for your own custom objects.
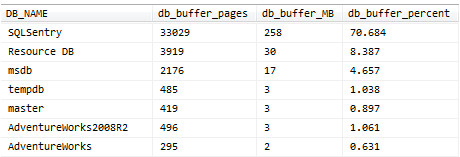
That all said, here are partial results from an instance on my local virtual machine:

Clearly, the SQLSentry database – while only representing 258 MB – occupies about 70% of my buffer pool for this instance. So now I know that I can drill into that database specifically if I want to track down the objects that are taking up most of that memory. You can once again use the sys.dm_os_buffer_descriptors only this time, instead of aggregating the page counts at the database level, we can utilize a set of catalog views to determine the number of pages (and therefore amount of memory) dedicated to each object.
USE SQLSentry;
GO

;WITH src AS
(
  SELECT
  [Object] = o.name,
  [Type] = o.type_desc,
  [Index] = COALESCE(i.name, ''),
  [Index_Type] = i.type_desc,
  p.[object_id],
  p.index_id,
  au.allocation_unit_id
  FROM sys.partitions AS p
  INNER JOIN sys.allocation_units AS au ON p.hobt_id = au.container_id
  INNER JOIN sys.objects AS o ON p.[object_id] = o.[object_id]
  INNER JOIN sys.indexes AS i ON o.[object_id] = i.[object_id] AND p.index_id = i.index_id
  WHERE
  au.[type] IN (1,2,3)
  AND o.is_ms_shipped = 0
)
SELECT
src.[Object],
src.[Type],
src.[Index],
src.Index_Type,
buffer_pages = COUNT_BIG(b.page_id),
buffer_mb = COUNT_BIG(b.page_id) / 128
FROM src
INNER JOIN sys.dm_os_buffer_descriptors AS b ON src.allocation_unit_id = b.allocation_unit_id
WHERE
b.database_id = DB_ID()
GROUP BY
src.[Object],
src.[Type],
src.[Index],
src.Index_Type
ORDER BY
buffer_pages DESC;
Here are the results from this database. Notice that I’ve captured both clustered and non-clustered indexes, for clustered tables and heaps, and for illustrative purposes I have also created an indexed view.

Please keep in mind that the buffer pool is in constant flux, and that this latter query has explicitly filtered out system objects, so the numbers won’t always add up nicely. Still, this should give you a fairly good idea of which objects are using your buffer pool the most.
When investigating the performance of your servers, buffer pool data is only a part of the picture, but it’s one that is often overlooked. Including this data will help you to make better and more informed decisions about direction and scale.

Javier is Content Specialist and also .NET developer. He writes helpful guides and articles, assist with other marketing and .NET community work


