Blazor is just another SPA framework like any other, but what makes it different from others? Blazor is written on top of .NET and it can be published as WebAssembly. Write your application in C#, empower it with .NET libraries and ship it as WebAssembly¹!
Blazor offers two different hosting models, Web Assembly and Blazor Server. Blazor-server runs codes on the server, use SignalR to communicates with the frontend. This offers easy debugging; The app is just like the old good ASP.NET Core app, which you used to debug every day. However speak of BlazorWasm, debugging has never been easy!
Blazor WebAssembly is in preview for ASP.NET Core 3.1, and at the moment debugging is limited, buggy and a bit difficult. For example, you can do:
- Set/Remove breakpoints
- F10, F8 step and resume in debugging
- Observe values of local variables that are int, string, or bool
- View the call stack
Only a few things can be done while debugging a BlazorWasm app, which means you cannot hover to see the values, you cannot step into async methods, you cannot evaluate an expression in the Browser Console.
In addition to what Blazor offers, I created a debugging library (called “BlazeDBG”) to go a little beyond the limits. First, start with what Blazor offers.
Getting Started
Debugging BlazorWasm is possible in Google Chrome (version 70 or later) or Microsoft Edge preview.
I have this simple Razor page in Blazor:
@page "/counter"

<h1>Counter</h1>

<p>Current count: @currentCount</p>

<button class="btn btn-primary" @onclick="IncrementCount">Click me</button>

@code {
    private int currentCount = 0;

    private void IncrementCount()
    {
        if(currentCount > 10)
            currentCount = 0;

        currentCount++;
    }
}
I want to debug the IncrementCount method.
To be able to debug, you need to run the Blazor app with a debug configuration profile. For doing this open a terminal inside the root of the project and execute the command below:
dotnet run --configuration Debug
- Navigate to the URL your app will be run on it. (https://localhost:5001).
- Press Shfit+Alt + D (on Mac Shift + Cmd + D)
Most of the time, Blazor and Chrome debugger cannot connect to your app and give you an error like this:

If you saw this window, copy the command and run Chrome with these arguments in Run:
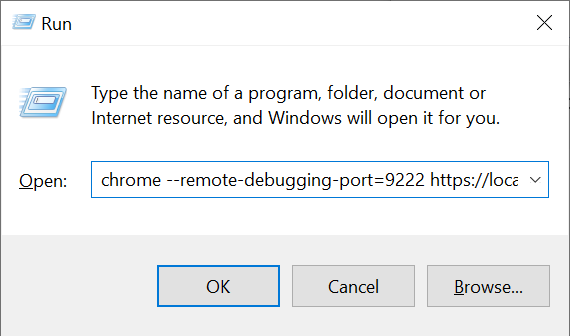
chrome --remote-debugging-port=9222 --user-data-dir="\Temp\blazor-chrome-debug" http://localhost:5000/
It will open Chrome, press the debugger key combination to open the debugger. Inside Sources and file:// you can see your source codes, set or remove breakpoints to control your application workflow.
As you can see, I cannot see the values of properties even by hovering mouse or add a watch. To be able to see the values inside your application, you can write data in the browser console by Console.WriteLine in Blazor code.
private void IncrementCount()
{
        Console.WriteLine(currentCount);

        if(currentCount > 10)
                currentCount = 0;

        currentCount++;
}
When running your app (debug profile is not needed), every-time the app reaches Console.WriteLine it will log it inside browser console.
Error diagnosis
Consider the code below:
@code {
    private int currentCount = 0;
private void IncrementCount()
    {
        int a = 0;
        int b = 0;
currentCount = a / b;
    }
}
The code above will throw an exception. If we run the app, you will see the error and stack state in the browser console.

- It tells you what exception has occurred.
- You can see what method and what line caused the error.
For example, The exception Attempted to divide by zero. has thrown in Pages.Counter.IncrementCount method in Counter.razor line 19.
These were the main things Blazor offers for debugging, but as we know Blazor supports JavaScript interop. By injecting some JS and implementing some helper methods in CThese were the main things Blazor offers for debugging, but as we know Blazor supports JavaScript interop. By injecting some JS and implementing some helper methods in C# we should be able to debug more!# we should be able to debug more!
I created a class which is just a hack by making interop between JS and .NET inside Blazor. I called it BlazeDBG.
BlazeDBG
Grab the interface and classes from GitHub.
- Register IBlazeDebugger as Singleton in your services.
public class Startup
    {
       public void ConfigureServices(IServiceCollection services)
       {
           services.AddSingleton<IBlazeDebugger, BlazeDebugger>();
       }
}
- Inject the object in your razor pages:
@using BlazeDBG;
@inject IBlazeDebugger BlazeDbg;
- Log whatever you wanted to the console:
@code {
    private int currentCount = 0;    private void IncrementCount()
    {
        BlazeDbg.ConsoleLog("counterCount before", currentCount);        currentCount++;        BlazeDbg.ConsoleLog("counterCount after", currentCount, LogLevel.Warn);
    }}


Javier is Content Specialist and also .NET developer. He writes helpful guides and articles, assist with other marketing and .NET community work