We do belive that sometimes your desktop end up with frozen or unresponsive. In this article, we will share few tips to debug it when your application crashed.
There’s a core issue that causes this problem, and that is a single UI thread. There’s just one thread that can make UI changes, respond to events, and so on.
We’re not going to talk why there’s just one thread for UI (though that’s an interesting topic). Instead, this article is about what we are to do when our .NET application freezes. We’re going to explore tools and debugging techniques to see where the program is stuck and to find the core cause of the issue.
1. Attach to the frozen process with Visual Studio
When you run your app from Visual Studio directly, you can hit Debug | Break All when the application freezes. Then, explore the Call Stack of the main thread to find out why the UI is stuck.
If you’re not running from Visual Studio, but VS is installed on the machine, you can attach to the hanged process and debug it in the same matter.
To attach in Visual Studio:
1. Open a Visual Studio instance (no need to open a solution or project)
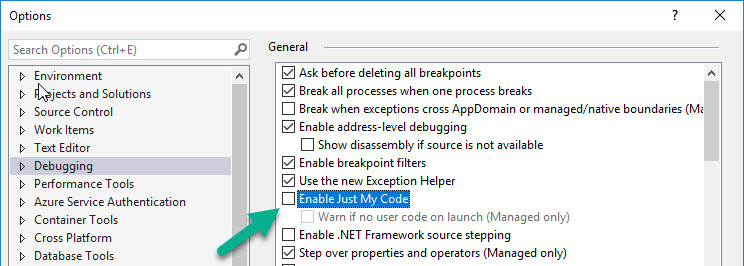
2. Uncheck “Enable Just My Code” in Tools | Options | Debugging (this might not be necessary on a development machine)
3. In the menu choose Debug | Attach to Process (Ctrl+Alt+P)
4. Choose your process from the list and click Attach
5. Hit Debug | Break All (Ctrl+Alt+Break) to stop the runtime and debug the problem.
If you’re on a development machine with symbol files (.pdb files) included and you have the same version of the source code as the running program, you will be able to see the source code. If not, you will still be able to see the Call Stack, Threads, and Locals windows. In most cases, that’s enough to find the deadlock.
In a desktop application, the most important thing to investigate is the UI thread. If your application is stuck, that means the UI thread is stuck.
Here is code example:
private void ButtonBase_OnClick(object sender, RoutedEventArgs e)
{
    Task.Run(() =>
        {
            Dispatcher.Invoke(() =>
            {
                Debug.WriteLine("Hello world");
            });

        }).Wait();

}
And here’s what I see when attaching to the process in Visual Studio:
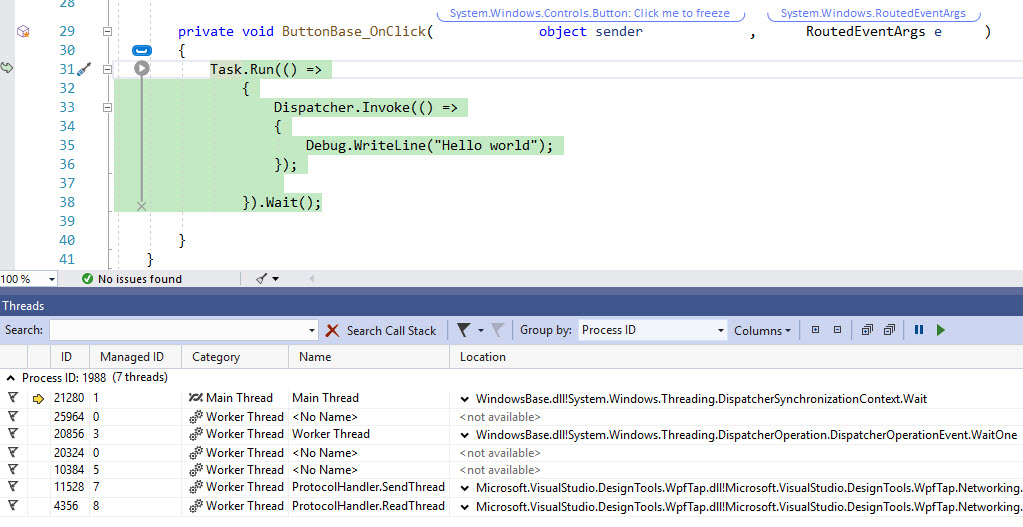
The image shows the main thread (UI thread) stuck on .Wait() of the task. Looking at the other threads will reveal that a worker thread (thread-pool thread) is waiting on Dispatcher.Invoke. So our program is hung because the worker thread is waiting on the UI thread, but the UI thread is never released because it’s waiting for the worker thread to finish.
2. Attach to the hung process with a performance profiler
Attaching to a performance profiler is a little different than attaching with Visual Studio. With a performance profiler, instead of breaking in a specific point, you will be able to record the execution for some time and see which methods are being called during the freeze. This is very useful when the hang is caused by some kind of infinite loop, or an infinite retry mechanism.
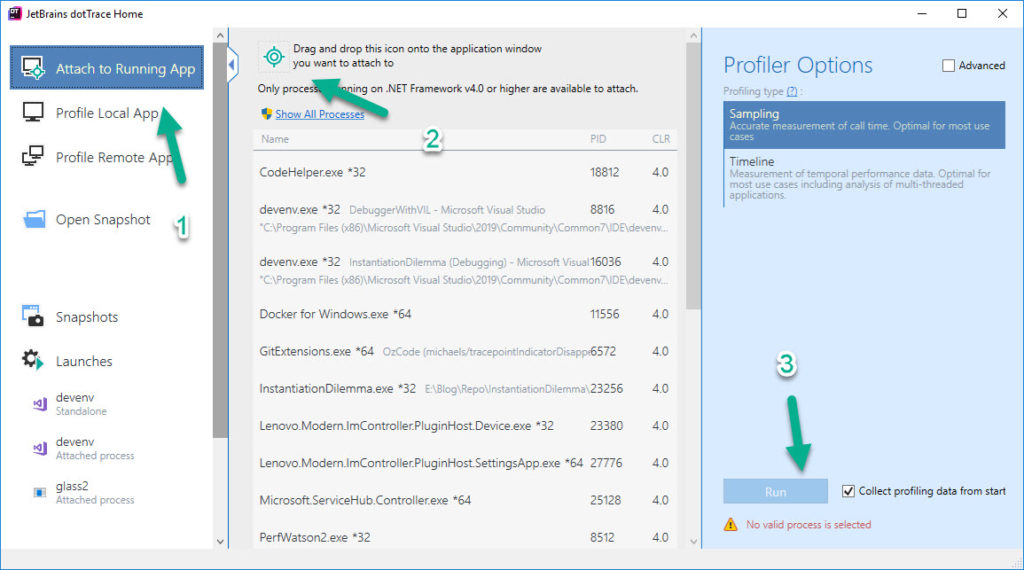
If you’re using the excellent dotTrace profiler like me, then follow these steps:
1. Open dotTrace
2. Choose Attach to Running App (topmost)
3. Choose your application by name or with the Drag & Drop tool
4. Choose Sampling
5. Click Run
6. After a few seconds of recording, click “Get Snapshot and Wait”. This will open a “Performance Viewer” window
7. Open the UI Thread only and investigate
3. Attach to the frozen process with dnSpy
dnSpy allows you to debug any .NET application without having the symbols or the original source code. It decompiles the code, shows it and even enables setting breakpoints inside the decompiled code.
This means that you can attach to your hanged process, hit Break (Ctrl + Break) and see the line of code where the process is stuck on any machine, including a production machine.
Using dnSpy is pretty much like using Visual Studio:
- Download and open dnSpy
Make sure you open the same bitness executable (x86, x64) as the debugged application. - Click Debug | Attach to process (Ctrl+Alt+P)
- Choose the stuck process from a list
- Hit Break (Ctrl+Break)
- Go to Debug | Threads window (Ctrl+Alt+h) and click on the main thread
- Go to Debug | Call Stack window and navigate to the topmost method in your own assembly. dnSpy will decompile everything, including the .NET framework, WPF, and whatever else you got going on.
- The decompiled source code will appear. You can set breakpoints, view locals, hover over variables, and so on.
4. Save a Dump to debug on another machine
A memory dump represents the entire memory at the time of capturing the Dump. When opening it in Visual Studio/WinDbg, you can see your program state at the time of saving the dump. This includes the exact line of execution in each thread, local variables and the entire memory heap if you captured a full-memory dump.
There are 3 parts to start debugging Dumps:
- Capturing the Dump file
- Opening the Dump in your tool of choice (Visual Studio, WinDbg)
- Matching to correct symbols and source code.
There are several ways to save a Dump file (.dmp). Some popular methods are:
- ProcDump command line tool (from SysInternals)
- Task Manager & Process Explorer
- From Visual Studio
5. Attach to a process with WinDbg
If you’ve been working on Windows applications long enough, you know that WinDbg used to be the go-to tool for windows debugging. For .NET, those days are (thankfully) gone. We now have Visual Studio and various other profilers as our first debugging choice.
Having said that, WinDbg can still save your hide once in a while. You can install it in a production environment, attach to the frozen process, and do some debugging. There are 4 reasons why you would use WinDbg:
- The production machine has nothing but WinDbg installed, and you can’t move a Dump file to a development machine for some reason.
- You need some WinDbg feature that other tools don’t have.
- You can debug the production machine with command line only. In that case, you probably need the command line alternative CDB.
- You are a WinDbg expert that can find problems with the command line faster than us youngsters with our fancy GUI tools.
To debug a frozen app with WinDbg, do the following:
- Open WinDbg
- In menu, choose File | Attach to a Process
- In menu, choose Debug | Break (Ctrl+Break)
6. Use PerfMon counters to get clues on the core reason of the hang
You can use PerfMon to check the frozen process for clues. PerfMon is a monitoring tool (pre-installed on Windows) that allows monitoring performance counters that measure a bunch of useful metrics.
Specifically, we are interested in CPU usage and memory usage of your process. If the CPU is at 0% during the freeze then it’s either a deadlock or an IO operation stuck (waiting for network request for example). If the CPU is at 100%, then it’s an infinite loop or a stuck calculation of some kind. Here’s an example of an empty infinite loop I added on the UI thread:
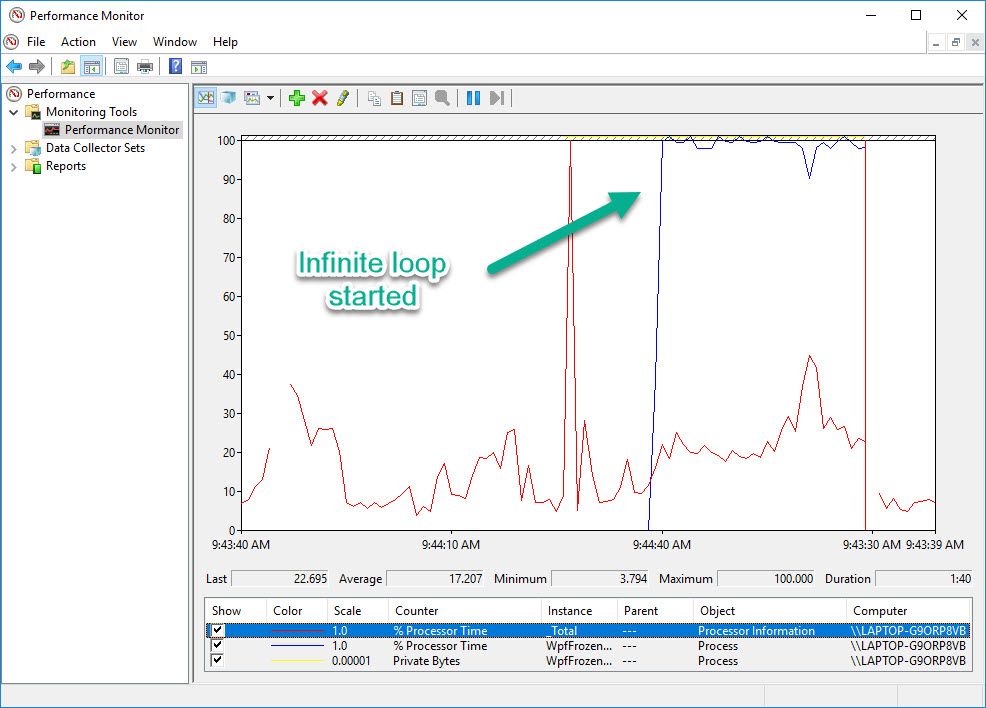
The counter for CPU is Process | % Processor Time.
We’re also interested in memory usage because in some rare cases, high memory consumption can cause a freeze. To see memory usage, use the counter Process | Private Bytes. If there’s a problem in memory, then you should use a memory profiler like dotMemory to investigate.
7. Automatically Save a Dump when a process freezes
This technique doesn’t help debug a frozen application, but it will show you how to automatically create a Dump file when the freeze happens. This can be useful in a number of scenarios:
- Your app freezes for a limited time and you need to catch the moment to save the Dump
- For a production server that restarts after some down time
- When the application state changes after several seconds into the freeze, and you need to save the dump file immediately
- If you want some kind of automatic reporting when your program hangs
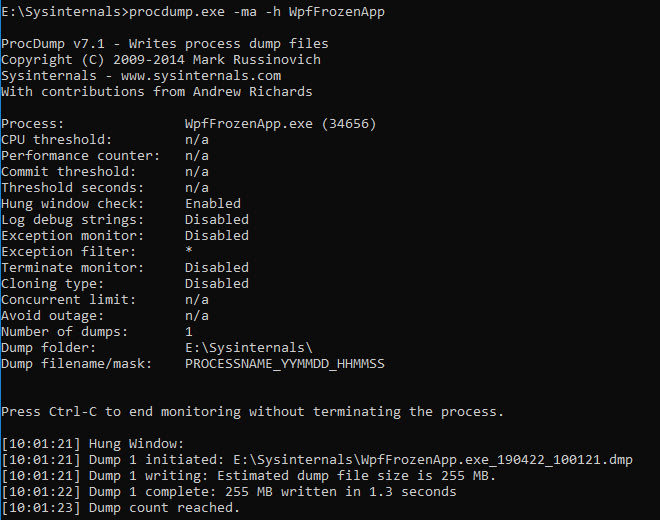
You can use ProcDump from SysInternals to monitor a process and automatically create a Dump when a window doesn’t respond.
For example, I can execute this command:
procdump -ma -h WpfFrozenApp
This will create a full memory dump (-ma) if a process has a hung window over 5 seconds(-h) for a process with the executable named WpfFrozenApp. The process needs to be already running at the time of executing this command line.
Summary
I hope this article was helpful to you and I wish for quick unfreezes in your future. We will keep updating about good article about Microsoft product, especially Asp.net. See you in next tutorial

Andriy Kravets is writer and experience .NET developer and like .NET for regular development. He likes to build cross-platform libraries/software with .NET.