Cloud computing, microservices, open source tools, and container-based delivery have made applications more distributed across an increasingly complex landscape. As a result, distributed tracing has become crucial to responding quickly to issues.
However, what precisely is distributed tracing? We’ll address that query and look at how groups can integrate sufficient observability into a cloud-native, highly distributed architecture to efficiently track transactions and evaluate their importance instantly.
What is distributed tracing?
Distributed tracing is a method of observing requests as they propagate through distributed cloud environments. It follows an interaction and tags it with a unique identifier. As the transaction engages with infrastructure, containers, and microservices, this identifier remains with it. This identifier in turn provides real-time visibility into the user experience across the entire stack, from the application layer at the top to the infrastructure at the bottom.
The tools that were once used to monitor the performance of monolithic applications are no longer suitable for the complex cloud-native architectures that now house them, as more agile and portable services replace them. Because of this intricacy, distributed tracing is essential to achieving observability in these contemporary settings.
According to a recent global survey conducted among 1,303 CIOs, 90% of organizations reported an acceleration of digital transformation in the previous year. Furthermore, according to 26% of those organizations, the pace of digital transformation will only quicken. This change necessitates effective observability in these more complicated contemporary settings.
The evolution of distributed tracing
In the past, when companies mostly developed monolithic applications, it was fairly easy to observe what happened inside of them. But as service-oriented architectures proliferated, it got more difficult to comprehend how particular transactions moved through an application’s different tiers. As a result, it became challenging to identify the underlying reasons for latency and execution time delays.
Internal collaboration faced difficulties as a result of this complexity. An organization could not identify which team was in charge of fixing the problem if it was unable to identify the microservice that was impacted. With so little visibility into activity in the environment, it was easy for troubleshooting sessions to devolve into war rooms where teams blamed one another.
Companies realized that their application environments needed to be more observable. But starting from scratch with in-house development resources was too expensive, too time-consuming, and would impede the flow of innovation. This need is now satisfied by distributed tracing, which helps businesses comprehend the performance problems affecting their microservices environments.
Which types of tracing are there?
Organizations may use different types of distributed tracing, including the following:
Code tracing. This approach involves a developer manually deciphering each application’s line of code’s output. Code tracing monitors the values of the variables as they change while the code is being executed in order to ascertain its output. This method allows for the analysis of smaller code blocks without requiring the execution of the full application, and it works especially well with them. It is believed that code tracing is a fundamental ability that improves code writing.
Data tracing. Data tracing is a tool that developers use to verify the quality and accuracy of critical data elements (CDEs), or information that is crucial to the business. In order to monitor those prioritized CDEs proactively, they also use this method to track them back to their source systems.
Program trace. An index of the instructions that have been carried out and the data that has been referred to during the operation of an application is provided by this command. Program trace is a common tool used by debuggers and other code analysis tools to enhance code during the software development process.
The advantages of Distributed Tracing
Teams and companies can benefit from distributed tracing in a number of ways, such as increased application performance, better adherence to service-level agreements (SLAs), and quicker time to market. The following are some of the most significant advantages of distributed tracing:
- Reduced mean time to detect (MTTD) and mean time to repair (MTTR). Teams can identify and resolve application performance problems more quickly with distributed tracing, frequently even before users become aware of any problems. When they find a problem, they can quickly figure out what’s causing it and fix it.Observability can also identify code that needs to be optimized and show performance bottlenecks anywhere in the software stack, alerting teams when microservices are not performing well.
- Improved compliance with SLAs. Additionally, the company can enhance its SLA compliance and preserve a top-notch user experience.
- Protected bottom-line growth. This helps the company keep a consistent flow of revenue and reduces possible negative effects on the bottom line.
- Faster time to market. Consequently, businesses can gain a competitive edge by introducing new goods and services to the market considerably faster.
- Improved internal collaboration. Distributed tracing not only helps to increase teamwork and communication, but it also helps to identify the precise areas where problems exist. Enhancing these working relationships is essential for timely troubleshooting as well as delivering innovations that lead to business growth.
The difficulties with Distributed Tracing
While distributed tracing has many benefits for organizations, there are drawbacks and obstacles to be aware of. Among them are the following:
- Manual instrumentation. While distributed tracing is intended to reduce development time, some tools force developers to instrument or modify their code by hand before letting them set up requests for distributed tracing. This requirement may require a lot of time and may inadvertently lead to coding errors. To complete this task, some teams might apply standardized procedures, which could lead them to miss some traces.
- Limited to back-end coverage. Certain tools that don’t employ an end-to-end distributed tracing strategy only produce a trace ID for a request upon reaching the initial back-end service, thereby masking the associated front-end user session. This makes it needlessly difficult to figure out whether the front-end or back-end team should handle a problematic request and find its root cause.
- Head-based sampling. Some traces might get lost if a tracing tool just randomly selects traces at the beginning of each request. Consequently, some traces might be absent or insufficient. This implies that high-priority traces, like requests from particular customers or high-value transactions, cannot always be sampled by organizations. Rather than adopting a head-based sampling strategy, an advanced observability solution can incorporate all of an organization’s traces and steer itself toward tail-based decisions. In this manner, the company is able to gather comprehensive traces that are labeled with particular priority attributes.
The principles of distributed tracing and the reasons for its necessity
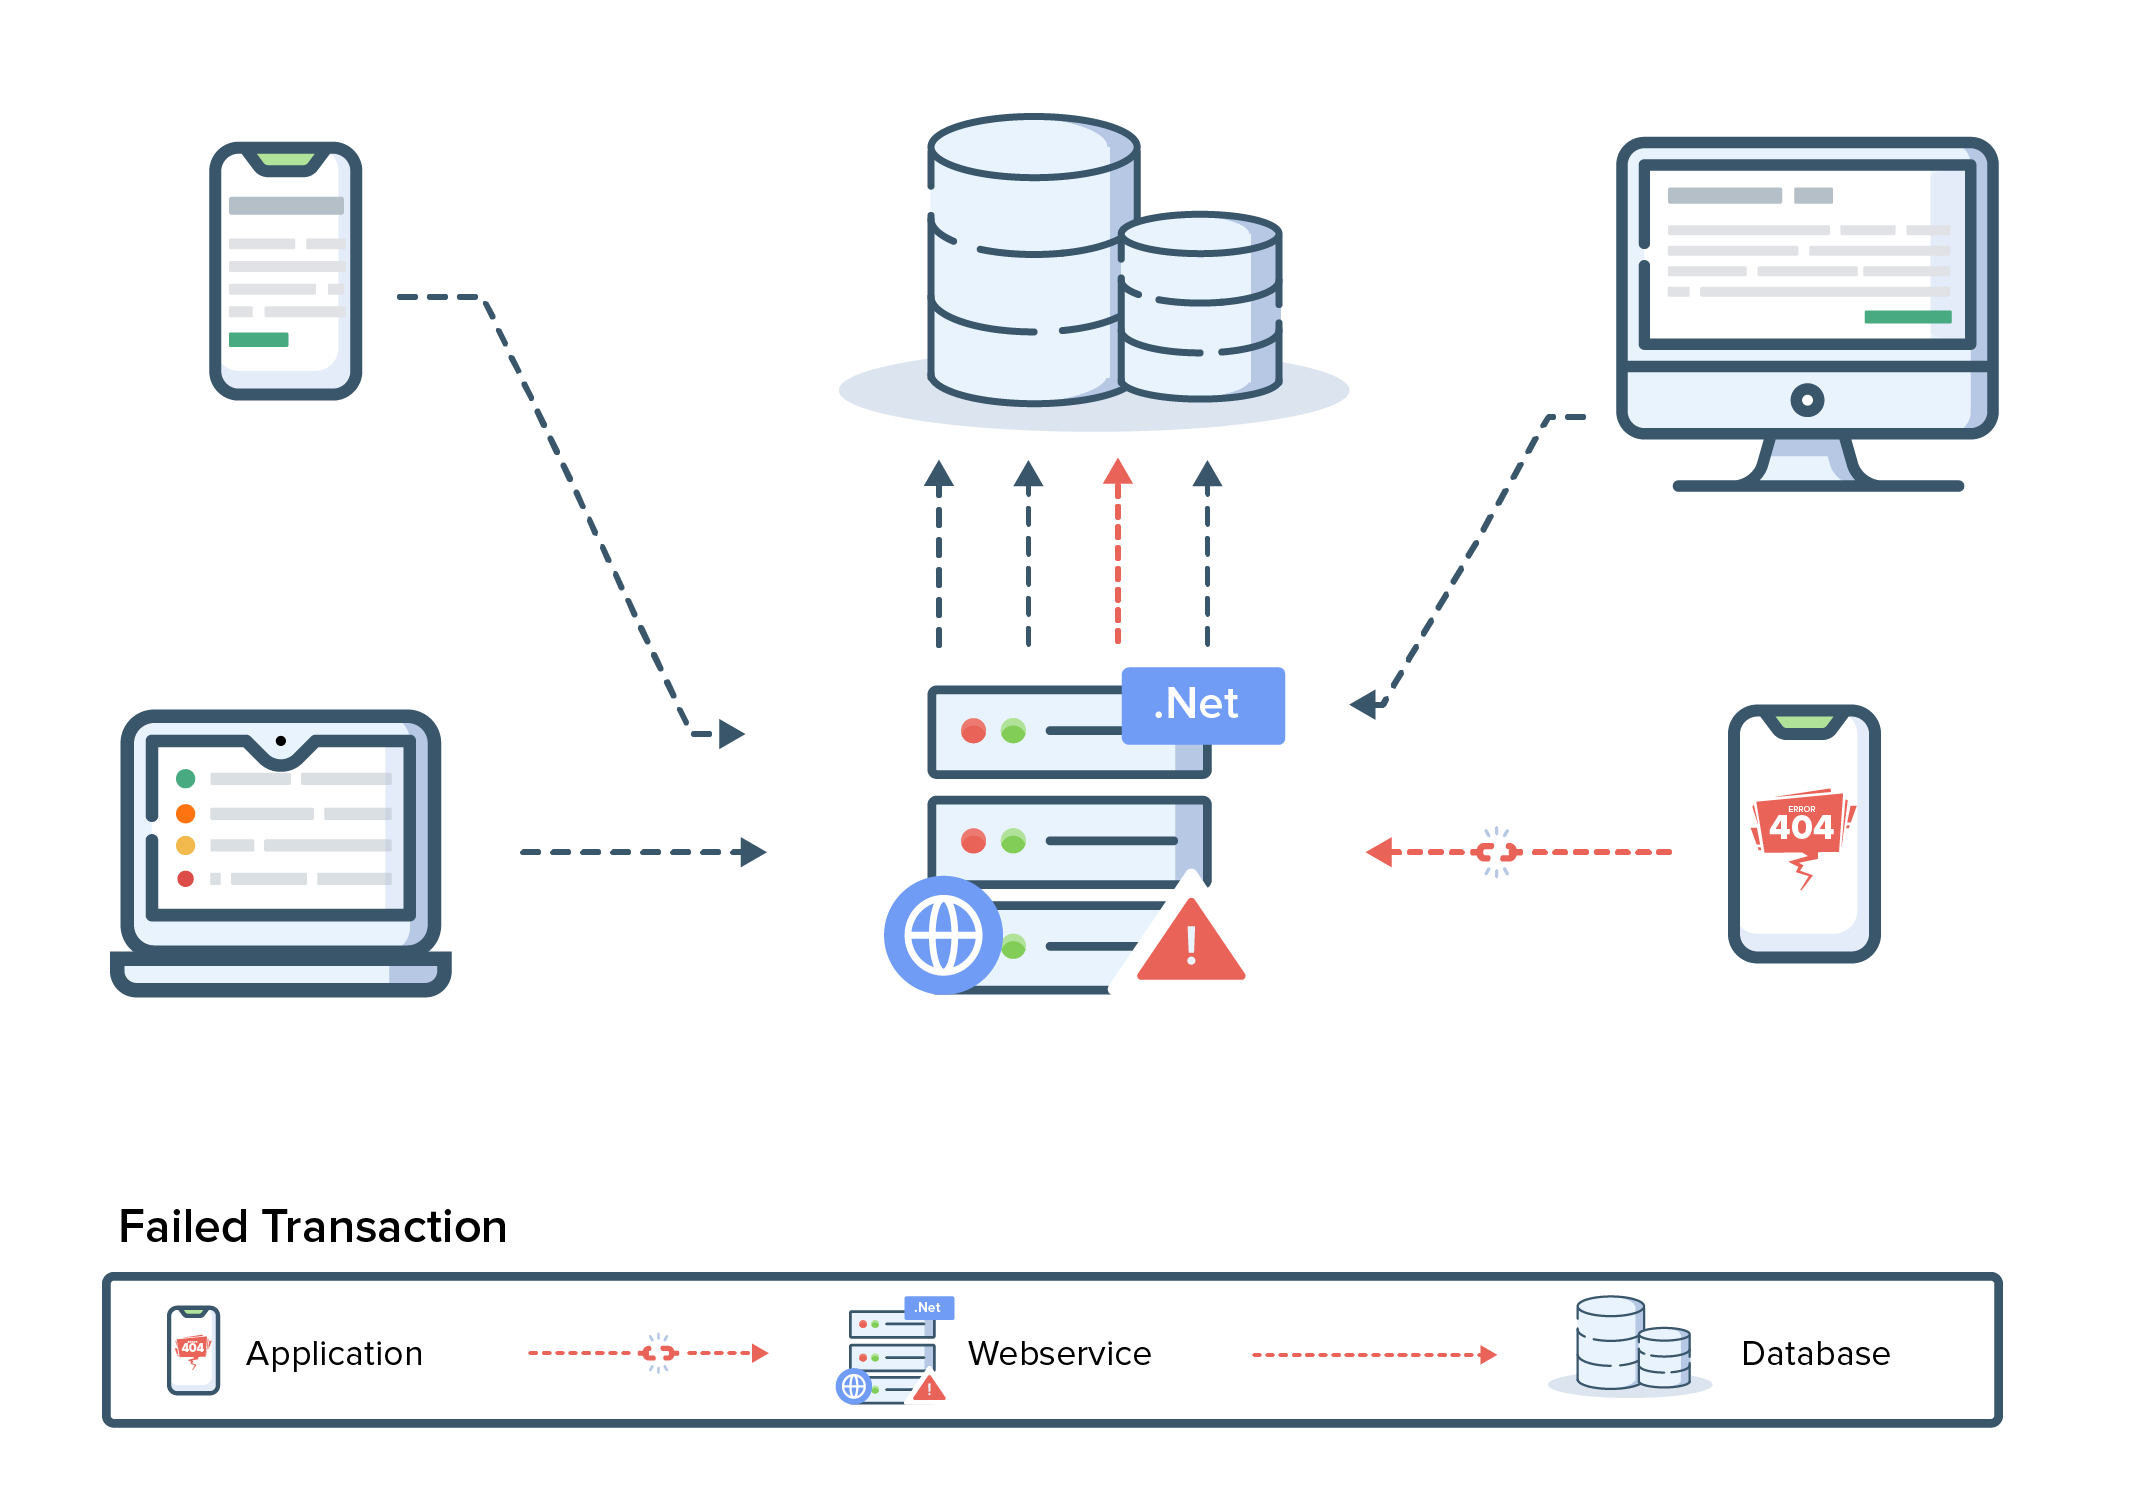
Monitoring, troubleshooting, and optimizing distributed software architectures like microservices—especially in dynamic microservices architectures—require distributed tracing. By gathering and examining information on each interaction with each service the request touches, it keeps track of a single request.
Every action that is brought about by a request, known as a segment or span, is tracked as it flows through and between services. A name, start and end timestamps, and additional metadata are among the data gathered. Following completion of one activity, or “parent” span, the subsequent activity moves to its “child” span. These spans are arranged correctly by the distributed trace.
Distributed tracing is necessary for businesses to help simplify the complexity of their contemporary application environments. There are more possible points of failure throughout the application stack when using distributed applications. This implies that when problems do occur, it may take much longer to find the underlying causes. The ensuing intricacy has a direct impact on a business’s capacity to uphold its SLAs and deliver an excellent user experience.
Teams can learn more about each microservice’s performance more quickly with the use of distributed tracing. They can quickly resolve problems, boost customer satisfaction, guarantee consistent revenue, and free up time for teams to innovate thanks to this understanding. In this manner, companies can minimize the difficulties that come with the inherent complexity of modern application environments while simultaneously maximizing their benefits.
When is distributed tracing used?
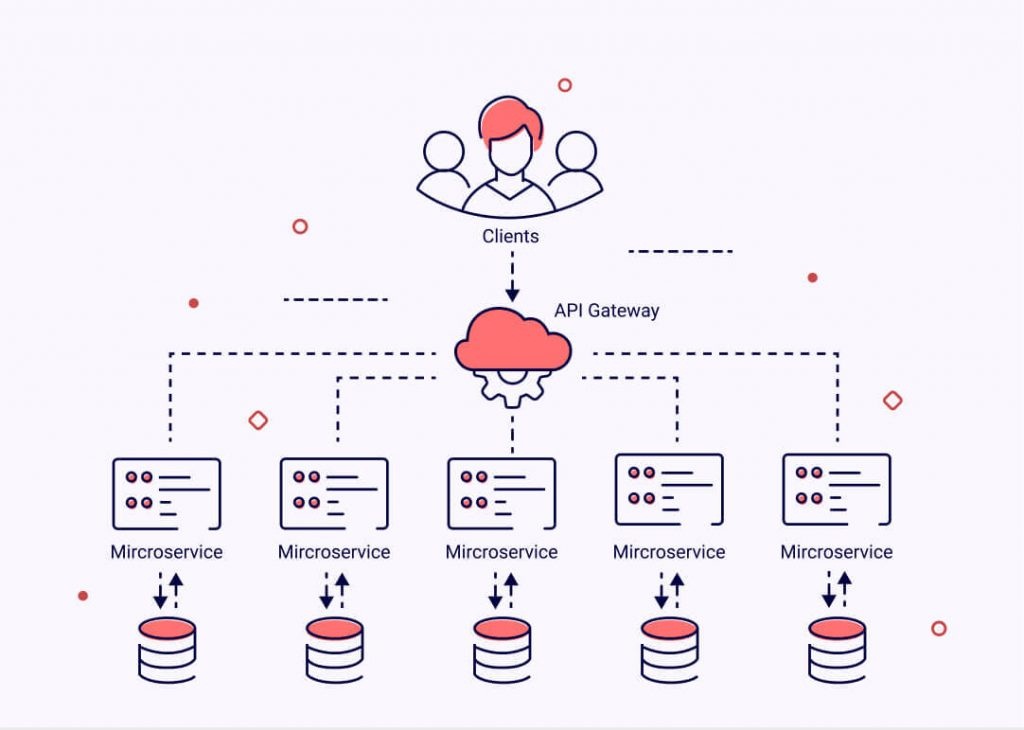
It gets harder to comprehend the relationships between microservices and figure out how they cooperate to fulfill requests when multiple microservices are linked to a single request. Particularly in serverless or microservices architectures, distributed tracing is crucial for promptly obtaining specific answers.
Distributed tracing comes in handy for DevOps, operations teams, and site reliability engineers (SREs) in the following scenarios:
- recognizing the state of microservices in a distributed system at the moment;
- quickly determining the underlying cause of errors in the same environment; and
- identifying performance bottlenecks that could have an influence on the user experience in the future or that already do.
In some microservices, distributed tracing can also be a tactical advantage for proactively optimizing faulty or inefficient code.
What distinguishes distributed tracing from logging?
Distributed tracing relies heavily on log files for its valuable details, but distributed tracing and logging are not the same. Log file writing is a science and an art in equal measure. Logs must be concise in order to avoid taxing system resources and yet contain sufficient information to initiate the proper action. It’s useful to first be aware of two different types of logging in order to comprehend the differences:
1. Centralized Logging
Centralized logging is a type of activity recording in which a group moves and keeps the logs produced by a service or component in one place. Teams can now centrally monitor error reporting and associated data. To facilitate easier reference and analysis, teams using microservices aggregate the logs from various microservices into a single location. This kind of logging focuses on finding the microservice that caused the errors and identifying errors that happen within the application. This becomes increasingly difficult in distributed environments where the logging data is generated by thousands of microservices.
Centralized logging necessitates that systems transfer logs from their source to a single location, despite being more convenient for developers. A significant amount of network resources may be used by this practice. This can therefore occasionally result in network performance problems that have an impact on other services and applications.
2. Distributed Logging
On the other hand, distributed logging is a technique for logging activities in logs dispersed throughout the computing environment, frequently over several clouds. This method can be used by organizations in place of centralized logging to lessen the workload associated with regularly moving and storing logs in one place.
Certain log storage options can also be picky, necessitating closer proximity to the log-generating device. Large-scale applications, like those made up of several microservices, frequently produce a lot of logs all the time. Teams might decide to employ a distributed logging strategy in these circumstances.
Distributed tracing and logging can be used simultaneously by teams. Typically, organizations start with logging and then add distributed tracing as their application environment gets more complex—using microservices, for instance.
The consequences of tracking across dispersed systems
Distributed tracing does more than just log a request’s complete path; it can track a request through hundreds of different system components with ease. It can also offer up-to-date information on the health of the system. Teams in charge of IT, DevSecOps, and SRE can now:
- Report on the state of microservices and applications to spot deteriorated conditions before a failure happens.
- Recognize unexpected behavior arising from automated scaling, which facilitates failure recovery and prevention.
- Examine the system’s average response times, error rates, and other digital experience metrics to see how end users are using it.
- Use interactive visual dashboards to keep an eye on key performance metrics.
- Troubleshoot systems, identify bottlenecks, and fix performance problems at the code level.
- Determine the underlying cause of invisible issues and address it.
Where conventional monitoring techniques falter
Distributed tracing depends on observability data from all environments in order to fulfill its mission of enabling data-driven decision-making. The three primary formats that traditional software monitoring platforms use to gather observability data are sometimes referred to as the “three pillars of observability”:
- Logs. Timestamped records of an event or events.
- Metrics. Numeric representation of data measured over a set period.
- Traces. A record of events that occur along the path of a single request.
Platforms used this data well in the past, for example, to track a request through an application domain. Before the emergence of microservices, Kubernetes, or containers, it was easy to see into monolithic systems. Yet, such data does not provide a comprehensive picture of system health in today’s environments, which are far more distributed and complex.
A good example is log aggregation, which is the process of merging logs from numerous different services. It might provide a quick look at what’s going on within a group of distinct services. However, contextual metadata that would give a complete picture of a request as it passes through potentially millions of application dependencies downstream is missing from the logs. This approach is just insufficient for troubleshooting distributed systems on its own. This is where distributed tracing—more specifically, observability—comes into play.
Observability is the benchmark for comprehending and gaining visibility into apps and services, as opposed to simple monitoring. Investigating the characteristics and trends of an undefined environment is beneficial. Among the many skills necessary to achieve the observability that contemporary businesses require is distributed tracing.
The consequences of tracking across dispersed systems
Distributed tracing does more than just log a request’s complete path; it can track a request through hundreds of different system components with ease. It can also offer up-to-date information on the health of the system. Teams in charge of IT, DevSecOps, and SRE can now accomplish the following:
- Report on the state of microservices and applications to spot deteriorated conditions before a failure happens.
- Recognize unexpected behavior arising from automated scaling, which facilitates failure recovery and prevention.
- Examine the average response times, error rates, and other digital experience metrics to see how the system is perceived by end users.
- Use interactive visual dashboards to keep an eye on key performance metrics.
- Troubleshoot systems, identify bottlenecks, and fix performance problems at the code level.
- Determine the underlying cause of invisible issues and address it.
Cloud intelligence for global dispersion
By revealing a request’s entire path as it moves through the application stack, distributed tracing provides enterprises with vital information about the performance of their applications. Organizations need to be able to obtain complete observability into the application environment because they are depending more and more on contemporary cloud-native apps to help them transform more quickly. Teams can guarantee a top-notch user experience and promptly find the core causes of application performance problems with distributed tracing, frequently even before users become aware of them.


Javier is Content Specialist and also .NET developer. He writes helpful guides and articles, assist with other marketing and .NET community work