Today I’d like to show you how to create a full-stack application and empower it with a reporting functionality. As a back-end technology, we’re going to use ASP.NET Core. For the front-end part, I’ve decided to pick Vue.js — fast, easy to learn, and powerful framework. If you have previous experience with React, it won’t be a problem for you to address this framework, too.
As a result, you’ll get a lightweight app with reporting functionality. To make things beautiful, we’ll try following material design guidelines to give our app native look & feel.
We’ll implement the web API on both sides by creating the front-end API client and the API server on the back end.
But for simplicity, we won’t be covering the details of the back end implementation. I believe the best tutorial to guide you through an ASP.NET Core web API creation is the official Microsoft Guide. This is why I’m going to focus more on front end development and UI design.
Prerequisites
- Basic knowledge of HTML, JavaScript, and CSS
- Familiarity with webpack
- Basic experience with ASP.NET Core
- Experience with MySQL or other SQL databases
- Patience and desire to code awesome things 🎉
Tools & technologies
- Vue.js framework + Flexmonster Pivot Table for Vue
- Visual Studio Code + Vue.js Extension Pack or any other IDE of your choice
- ASP.NET Core
- MySQL + MySQL Workbench
- Postman for testing the API server
Prepare a database
For demonstration purposes, I’ve created a test database with three tables and populated them with sample records. If you wish to stay with me on the same page throughout the tutorial, you can set up the MySQL server. You can work with a custom data set. In the latter case, you need to apply some changes to the back-end code: change existing classes to make them correspond to your data model entities as well as change data transfer object classes (DTOs), controllers, and repositories. I think this will not be a hard task for you to handle.
Create Vue.js project
Assuming you already have a working back end, let’s take care of a user interface of our future app. At the very end, we’ll make them both communicate: the front end will be sending data requests to the back end and create visualization upon obtaining this data.
- Install Node.js and npm — a CLI for JavaScript libraries management.
- To create an application using the command line, you need to install the Vue CLI:
npm install -g vue-cli
Here, the -g argument stands for installing the Vue CLI globally.
- Create a Vue.js project using the webpack template:
vue init webpack reporting-app-vue
The thing I like about the webpack boilerplate is that it ships with all the necessary features such as hot-reloading, linting, testing, and CSS extraction.
After running this command, you are asked to specify the project’s name without capital letters, its description and the author. At this stage, it’s essential to pick Router since we’ll be setting up routes for different pages.
Other features to choose are the linter and unit tests. It’s up to you whether to use ESLint or not. But remember that it enforces you to follow a consistent style in your code. You can read more about the different rules of ESLint here.
Here are the minimal options I’ve chosen:

Our project is scaffolded and ready to work with. Open it in your favorite IDE and check its structure:
- src is a directory contains module assets, UI components, and router;
- App.vue is the entry point component;
- main.js is the entry point file that mounts App.vue.
To feel confident about the purpose of each folder, read about the structure of the generated project in more detail here.
So, let’s take the front end for a test drive by running npm run dev .
And here we go:
Bootstrap components
To make our user interface look stylish in minimal time, we’ll use premade components of Bootstrap for Vue.js. Let’s install it:
npm i bootstrap-vue
Next, open the main.js file, import BootstrapVue along with its styles, and make Vue.js register Bootstrap components by calling Vue.use() — a method that installs Vue plugins.
import { BootstrapVue, BootstrapVueIcons } from 'bootstrap-vue'
import 'bootstrap/dist/css/bootstrap.css';
import 'bootstrap-vue/dist/bootstrap-vue.css';

Vue.use(BootstrapVue);
Vue.use(BootstrapVueIcons)
Install Flexmonster Pivot Table & Charts
To work with this JavaScript library in our Vue project, we need to install it. One by one, run the following commands:
npm i vue-flexmonster --save
npm install --save flexmonster
We can register the vue-flexmonster module globally or locally. Let’s follow the first approach. Simply import the module and its styles to main.js:
import Pivot from 'vue-flexmonster';
import 'flexmonster/flexmonster.css';
And register it as a plugin:
Vue.use(Pivot);
Now the module is globally accessible.
Here’s how main.js looks like now:
import 'bootstrap/dist/css/bootstrap.css';
import 'bootstrap-vue/dist/bootstrap-vue.css';
import {
    BootstrapVue,
    BootstrapVueIcons,
} from 'bootstrap-vue';
import Pivot from 'vue-flexmonster';
import 'flexmonster/flexmonster.css';
import Vue from 'vue';
import App from './App';
import router from './router';

Vue.use(BootstrapVue);
Vue.use(BootstrapVueIcons);
Vue.use(Pivot);
// eslint-disable-next-line no-new
new Vue({
    el: '#app',
    router,
    components: {
        App,
    },
    template: '<App/>',
});
Note that we placed the absolute imports before the relative ones, just as ESLint rules require.
Create navigation
Let’s move on to building our first component.
It will be responsible for navigating between pages.
To allow end-users to switch between multiple reports, we’ll create a separate UI element — a navigation bar. It will direct them to three kinds of reports:
- A sales management report
- An HR performance dashboard
- A digital marketing dashboard
Create a Navbar.vue component inside the components folder and add the template and script to it:
<template>
  <b-nav tabs>
    <b-nav-item :to="{ name: 'SalesReport' }"><a class="nav-link active" data-toggle="tab"><b-icon-graph-up></b-icon-graph-up> Quarterly Sales Report</a></b-nav-item>
    <b-nav-item :to="{ name: 'HRReport' }"><a class="nav-link active" data-toggle="tab"><b-icon-people></b-icon-people>HR Performance Dashboard</a></b-nav-item>
    <b-nav-item :to="{ name: 'MarketingReport' }"><a class="nav-link active" data-toggle="tab"><b-icon-phone></b-icon-phone> Digital Marketing Dashboard</a></b-nav-item>
  </b-nav>
</template>
<script>
export default {
  name: 'Navbar',
};
</script>
As you see, we’re using Bootstrap <b-nav> control. Its main benefit is that you can create tabbed content that changes with the route URL. Learn VueJs online with the best VueJs tutorials to handle large amounts of user interactions and dynamic data.
To each tab, we assign values to to— router-link property. Through passing a JSON object to this property, we’re making the tab’s link point to the specified component.
Here in the code, you see the names of three components. Don’t worry they don’t exist yet — this is exactly what we’re going to take care of in the next section of the tutorial.
Create report components
And now to the reports designing! We’re going to add two Flexmonster instances on every page: one is for a pivot table, the other — for pivot charts. Alternatively, you can arrange as many instances as you like: the only precaution is to use different references for different objects.
In the components directory, create the SalesReport.vue file.
Inside the <template> tag, create one root <div> element under which we’ll place our reporting components.
<template>
  <div>
    <Pivot
      ref="pivotSales"
      v-bind:toolbar="true"
      v-bind:report="{}"
    >
    </Pivot>
    <h3 class="salesTitle">Annual Revenue by Retail Categories</h3>
    <Pivot
      id="salesCharts"
      ref="pivotChartSales"
      v-bind:toolbar="false"
      v-bind:report="{}"
    >
    </Pivot>
  </div>
</template>
We also added an idattribute to the pivot charts to be able to change its styles later on.
Add the export default statement in the same file:
export default {
    name: 'SalesReport'
};
Similarly, create another two components in the same folder, called HRReport.vue and MarketingReport.vue.
Yet, we have no data inside the components. But how to test them before fetching the data from the server? We can solve is simply: let’s provide a link to the sample report:
Routing
So far, excluding the navigation bar, we’ve created three Vue components and added links to them in the navigation bar. Now we need to tell the application where to look for the pages that correspond to these components, namely to specify their URLs. For this, let’s open the index.js file from the router directory, import the components and point the router to the page components by adding them to the list of routes.
Now our toolbar works as expected. Now we can switch between tabs.
Display data from the back end
Let’s figure out how to direct HTTP requests from our front end to the back end. Let me remind you that our server’s endpoint is located at http://localhost:5000/api.
Configure environment files
Open the config directory and add a new environment variable in the dev.env.js file:
'use strict'
const merge = require('webpack-merge')
const prodEnv = require('./prod.env')

module.exports = merge(prodEnv, {
  NODE_ENV: '"development"',
  API_ENDPOINT: '"http://localhost:5000"'
})
To point HTTP requests to the back end in the production mode, correspondingly modify the config/prod.env.js file.
For making HTTP requests from Node.js, we’ll use Axios — a Promise-based HTTP client for the browser and Node.js. At the time of writing, it supports the latest versions of all browsers, including IE 11.
Run npm i axios to install it. Import Axios to the main.js file and make it use the API_ENDPOINT variable as the base URL for all Axios requests:
import Axios from 'axios';
Axios.defaults.baseURL = process.env.API_ENDPOINT;
Create API services
Let’s create an API service. With its help, we’ll be fetching data from the back end.
In src, create a folder that will hold different API services. Name it api-services. Create a new file order.service.js. Inside it, import Axios and implement the getAll() call:
/* eslint-disable */
import Axios from 'axios';

const RESOURCE_NAME = '/api/orders';

export default {
    getAll() {
      return Axios.get(RESOURCE_NAME);
    }
  };
Note that for our reporting purposes, the only method we need is getAll(). You can also add other RESTful calls, such as create, update, delete.
Knowing the design of your database, accordingly, you can create separate API services for each entity. In our case, we also need to add employee.service.js and marketing.service.js.
Send data to the pivot table and pivot charts
Now let’s get back to our components. How do we fill them with data?
We could set the data for each component using the data() function that returns JSON with keys and values. But instead, we’ll make use of Flexmonster API calls. This way we’ll learn how to work with them in Vue.
Using flexmonster.setReport(), we’ll define a report with data and all the rows, columns, and measures right within the mounted() hook. If you doubt which hooks to choose for different scenarios, I encourage you to take a look at this diagram. It will help you understand the lifecycle of Vue instances better.
If you want simply to connect the data without setting a report for the pivot table, you can invoke the flexmonster.connectTo() method.
And now to the point. Open SalesReport.vue and import corresponding API service.
import OrderService from '@/api-services/order.service';
Add the mounted() hook to the exported component:
mounted() {
    OrderService.getAll()
        .then((response) => {
            const responseData = response.data;
            const report = {
                dataSource: {
                    type: 'json',
                    data: responseData,
                    mapping: {
                        orderId: {
                            type: 'string',
                            caption: 'Order ID',
                        },
                        country: {
                            type: 'string',
                            caption: 'Country',
                        },
                        city: {
                            type: 'string',
                            caption: 'City',
                        },
                        orderDate: {
                            type: 'date',
                            caption: 'Order Date',
                        },
                        contactName: {
                            type: 'string',
                            caption: 'Contact Name',
                        },
                        quantity: {
                            type: 'number',
                            caption: 'Quantity',
                        },
                        retailCategory: {
                            type: 'string',
                            caption: 'Retail Category',
                        },
                        price: {
                            type: 'number',
                            caption: 'Price',
                        },
                    },
                },
                slice: {
                    rows: [{
                            uniqueName: 'country',
                        },
                        {
                            uniqueName: 'retailCategory',
                        },
                    ],
                    columns: [{
                            uniqueName: 'orderDate.Year',
                        },
                        {
                            uniqueName: '[Measures]',
                        },
                    ],
                    measures: [{
                            uniqueName: 'price',
                            aggregation: 'sum',
                        },
                        {
                            uniqueName: 'quantity',
                            aggregation: 'sum',
                        },
                    ],
                    expands: {
                        rows: [{
                                tuple: ['country.[australia]'],
                            },
                            {
                                tuple: ['country.[japan]'],
                            },
                            {
                                tuple: ['country.[norway]'],
                            },
                            ],
                        },
                    },
                };
                this.$refs.pivotSales.flexmonster.setReport(report);
                const pivotChartReport = {
                    dataSource: {
                        type: 'json',
                        data: responseData,
                        mapping: {
                            orderId: {
                                type: 'string',
                                caption: 'Order ID',
                            },
                            country: {
                                type: 'string',
                                caption: 'Country',
                            },
                            city: {
                                type: 'string',
                                caption: 'City',
                            },
                            orderDate: {
                                type: 'date',
                                caption: 'Order Date',
                            },
                            contactName: {
                                type: 'string',
                                caption: 'Contact Name',
                            },
                            quantity: {
                                type: 'number',
                                caption: 'Quantity',
                            },
                            retailCategory: {
                                type: 'string',
                                caption: 'Retail Category',
                            },
                            price: {
                                type: 'number',
                                caption: 'Price',
                            },
                        },
                    },
                    slice: {
                        rows: [{
                            uniqueName: 'retailCategory',
                        }, ],
                        columns: [{
                            uniqueName: 'orderDate.Year',
                        },
                        {
                            uniqueName: '[Measures]',
                        },
                        ],
                            measures: [{
                            uniqueName: 'Revenue',
                            formula: "sum('price') * sum('quantity')",
                            individual: true,
                            caption: 'Revenue',
                            format: '-46ca9u7j6jy00',
                        }, ],
                        sorting: {
                            column: {
                                type: 'asc',
                                tuple: [],
                                measure: {
                                    uniqueName: 'Revenue',
                                },
                            },
                        },
                    },
                    options: {
                        viewType: 'charts',
                        chart: {
                            type: 'bar_h',
                        },
                    },
                    formats: [{
                        name: '-46ca9u7j6jy00',
                        currencySymbol: '$',
                    }, ],
                };
                this.$refs.pivotChartSales.flexmonster.setReport(pivotChartReport);
            })
            .catch((error) => {
                // eslint-disable-next-line no-console
                console.log("The data hasn't been loaded", error);
            });
},
As you see, inside this hook, we request the data from our server through the API service we recently created. Right there, we also create a report object and set it to the component using the setReport() method.
Similarly, you can set reports for other components: HRReport and MarketingReport.
Set mapping
You may have noticed that the names of the fields from MySQL tables are displayed in the way they are specified inside the database. We can change it and prettify field names using the mapping property of the report. Simply add this object to the report’s dataSource property.
Design a reporting tool
To prettify our dashboard, you can use a material design palette generator and pick those colors for charts that match your preferences.
Putting everything together
Now it’s time to see how the back end and front end work together. Start your ASP.NET Core application by running the IIS server. Once it’s up, you can run the front end and click each tab to check different reports. All these reports are filled with the data from your database.
Improving performance
Note that the data we send to the pivot table component is processed on the client side.
The speed of data processing hugely relies on your browser resources. Up to hundreds of megabytes, it’s usually done fast. But if you’re dealing with larger amounts of data or simply wish to optimize data processing at your data access layer, there’s an option for you. I encourage you to try setting up the .NET Core server that implements the API exposed by Flexmonster. This approach will significantly accelerate your server-side data processing and let you bypass browser limitations. You can find all the instructions on how to implement it in the official guide. If your server runs on Node.js, you can also try the Node.js sample server or realize the server-client communication by yourself.
Results
Let’s inspect the results!
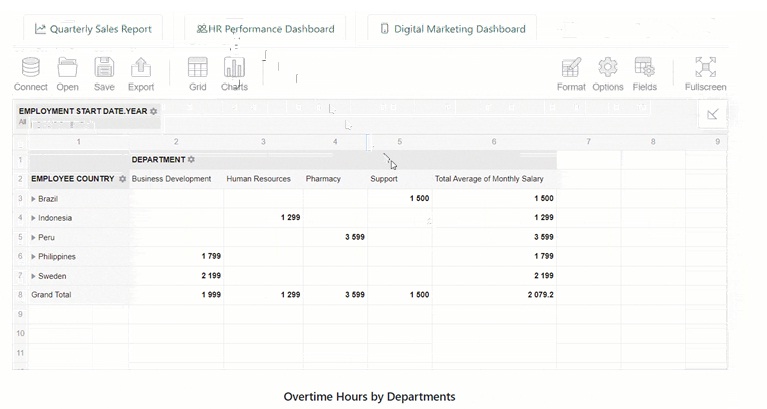
Here’s the reporting tool you’ve built so far. You can use it with any data and for any business cases.
Final Word
Today you’ve learned how to create a beautiful app using Vue.js, ASP.NET Core, MySQL, and Pivot Table for Vue. I hope you’re satisfied with the results. You can try building a similar application using other client-side and server-side technologies. Or other data sources.


Andriy Kravets is writer and experience .NET developer and like .NET for regular development. He likes to build cross-platform libraries/software with .NET.