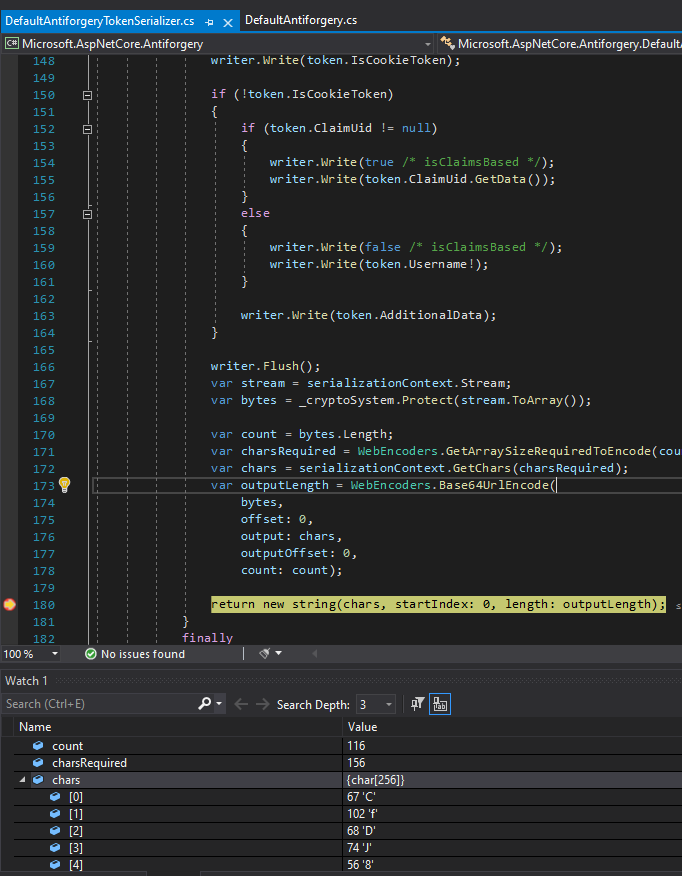
This is something that took me a long time to get working, and there is not much help out there on the internet.
So I’m writing this article to give you the help I wish I had when I was trying to work this out.
Why?
Maybe you’re just curious as to how things work behind the scenes, or maybe you’ve found a bug, or need some code you don’t have access to. Whatever your reason is, this article will help you skip all the issues I had.
How?
There are many ways to debug the source code. Here are three popular methods:
- .NET Reflector
- Microsoft symbols server
- Reference the source code
The problem with the first two is that they’re slow, and it is very difficult to view the values of local variables in the Watch window.
This is because the code is optimized, even if you select “Suppress JIT optimizations” and build in Debug mode:

In this article I’ll show you how to debug by referencing the source code.
What version do you need?
The first thing is to think about what version of ASP.NET Core you want to debug.
Without thinking, I went and downloaded/built the master branch which had .net6.0 code, and wondered why it wouldn’t work with my ASP.NET Core 5 project.
In the next step, you will need to check out the correct branch which has the same version of ASP.NET Core that you’re using in your app.
Check out and build
Before you continue, please make sure you create a folder direclty in your C drive to clone the source code. Otherwise you’ll get errors about file paths being too long.
Then follow these instructions (or these if you want to debug Runtime).
Make sure you read the entire article. I can’t stress this enough. I rushed in and tried to build the solution from Visual Studio. You need to build from the command line. This is just one of many things that can go wrong if you rush.
If you get errors, read the troubleshooting section before going to Google.
Add the required project/dll to your solution
Add the project
Right click your solution in VS and select Add -> Existing Project.
Then select the .csproj file for the code you wish to debug.
In my case I needed to debug the Antiforgery code:

Add the dll
In addition to the previous step, the dll must also be added.
If you add a project reference to the .csproj in your solution instead of adding the dll, you won’t be able to view the value of some local variables when you debug.
You’ll see the following error:
Cannot obtain value of local or argument as it is not available at this instruction pointer, possibly because it has been optimized away
To make sure you can view the values in the Watch window, you need to add the dll instead of referencing the project.
The dll will be located in the following folder:
C:\aspnetcore\artifacts\bin\<ProjectOfInterestHere>\Debug\<Version>
eg:
C:\aspnetcore\artifacts\bin\Microsoft.AspNetCore.Antiforgery\Debug\net5.0
Add the dll by right clicking on your main project, and selecting Add -> Project Reference -> Browse
Add breakpoints and enjoy debugging!
Now you’re all ready to go. Add your breakpoints, run your application and view variables’ values in the Watch window.

Conclusion
I hope you’ve found this article helpful. Happy Coding!

Yury Sobolev is Full Stack Software Developer by passion and profession working on Microsoft ASP.NET Core. Also he has hands-on experience on working with Angular, Backbone, React, ASP.NET Core Web API, Restful Web Services, WCF, SQL Server.


