We all understand the importance of debugging. Inspecting variable values, seeing the call stack, and moving step by step are all valuable features for developers. However, it is not always easy to initiate a debugging session in real-world scenarios. Sometimes you can’t get the debugger to work. Or you’re starting the program from the command line and want to debug from the beginning. Perhaps the app crashes as soon as it starts. Perhaps you want to debug your tests but are unsure how. In many cases, I find myself using log traces rather than the much more powerful debugger.
There are a few techniques that can help you debug any process in any situation. In this post, you’ll learn how to use Visual Studio Code and Chrome DevTools to debug, auto-attach, and launch the debugger for any Node.js process or JavaScript code.
1. Attach from Visual Studio Code
When you start working on a new project, there is usually an existing configuration that allows you to debug your app directly from the IDE. But, in the unlikely event that there is no configuration, and for the sake of clarity, let’s see how to debug a simple Node.js process without any configuration.
Start by running your Node app as usual.
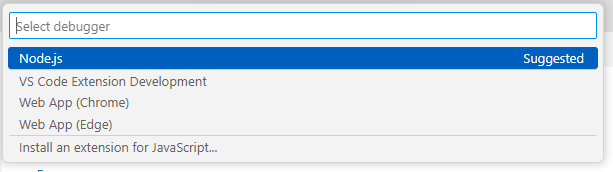
In Visual Studio Code, press Ctrl + Shift + P (to see all commands), and choose Debug: Attach to Node Process.
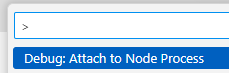
Select your Node process (probably the only one on the list). The debugger will now attach, allowing you to place breakpoints, inspect values, and so on.
Note that the standard way to debug a Node process is to use the --inspect parameter. e.g node --inspect index.js. This will open a port for a debugger to attach. However, Visual Studio Code uses a SIGUSR1 signal to be able to debug even Node processes that didn’t open a debugger port.
Attach at project startup
Often, you will need to debug something during the project’s startup. Attaching to a running process will not help, but Node has a useful command-line parameter for stopping at a breakpoint in the project’s first line. The parameter is --inspect-brk, which results in a start command line similar to node --inspect-brk index.js. In existing projects, you’ll often find debug scripts in package.json like this:
"scripts": {
  "start": "node index.js",
  "debug-break": "node --inspect-brk index.js",
  "debug": "node --inspect index.js"
}
This allows you to execute npm run debug-break to the same effect.
After running this script, you can attach to Node Process in Visual Studio Code or Chrome DevTools, where the execution is paused on the first line of code.
Start debugging from Visual Studio Code with “F5”
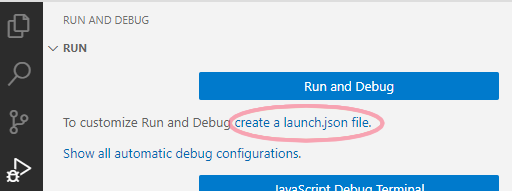
Visual Studio Code lets you create a launch.json file that contains the command to run your project. The advantage is that when executed from Visual Studio Code, it knows to immediately attach the debugger. To configure it, press Ctrl + Shift + D in Visual Studio Code’s Run and Debug pane, then select “create a launch.json file”.
Choose Node.js and you’re all set.
The default launch.json is:
{
    "version": "0.2.0",
    "configurations": [
        {
            "type": "node",
            "request": "launch",
            "name": "Launch Program",
            "skipFiles": [
                "<node_internals>/**"
            ],
            "program": "${workspaceFolder}\\index.js"
        }
    ]
}
Now that you’ve configured it, click F5 (Start Debugging) to launch your Node.js process with Visual Studio Code’s debugger attached.
2. Auto Attach with Visual Studio Code
In some cases, using the standard “Attach to Process” and “Start Debugging” will not work. For example, if you want to debug some tests but don’t want to spend half a day figuring out how to modify the test command line. Alternatively, you can debug a custom build pipeline tool (such as linters, bundlers, or webpack plugins).
You can easily handle these cases by instructing Visual Studio Code to automatically attach to any running Node.js process. There are two ways to do this:
Using JavaScript Debug Terminal
If you go to Visual Studio Code Terminal and click the “+” button, you can open a JavaScript Debug Terminal.
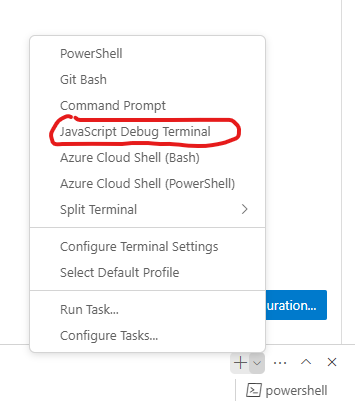
It appears to be a regular terminal, but the difference is that any Node.js process launched from this terminal window will be automatically attached to by VSC’s debugger. To debug your tests, simply run the test command (e.g., npm test) in the JavaScript Debug Terminal, and Visual Studio Code will automatically debug any running JavaScript (or TypeScript) code.
Using Auto Attach in Visual Studio Code
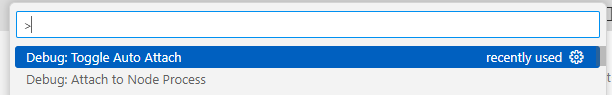
Another way to begin debugging any process that begins in the terminal is to use the Auto Attach feature. To begin, press Ctrl + Shift + P to search for the command “Debug: Toggle Auto Attach”.
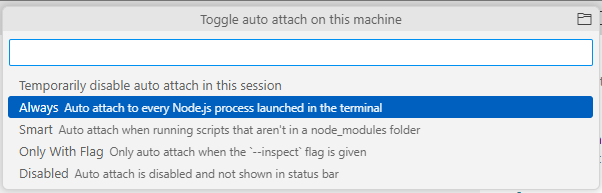
Choose the “Always” mode.
You can now start and debug Node.js processes from the regular terminal.
It is important to note that the adjusted settings will only work if you open a new terminal tab.
This feature has some advantages, such as the “Smart” option, which excludes the node_modules folder. It also works with services such as nodemon, which restarts your app when the code changes. This is especially useful because you can change the code and the debugger will reattach automatically once the new process begins.
3. Attach with Chrome Developer Tools
If you’re used to debugging front-end JavaScript code with Chrome Developer Tools and want to stick with what you know and love, I don’t blame you. The DevTools debugger is one of the most user-friendly ever created (despite the fact that they use the F8 shortcut for “continue” rather than the obvious F5 shortcut). Also, even if you’re satisfied with Visual Studio Code, having another option is always beneficial. VSCode may not work for some reason, or you may require some unique features from Chrome DevTools.
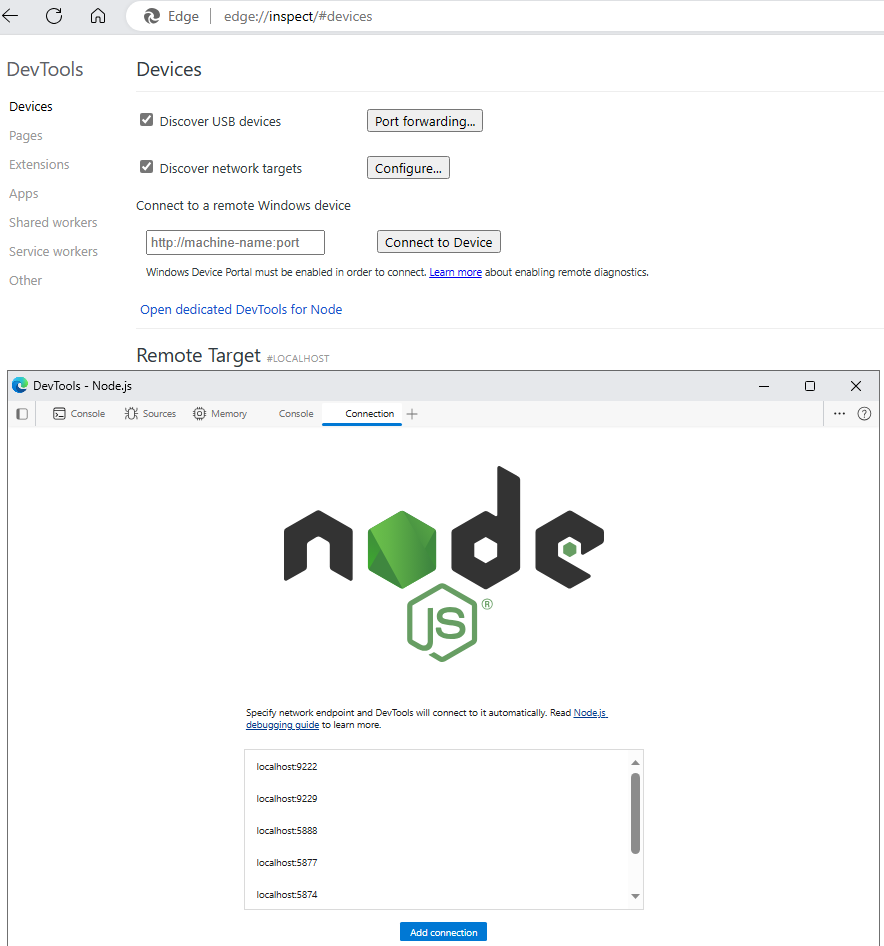
To get started, navigate to chrome://inspect (or edge://inspect for Microsoft Edge) and select “Open dedicated DevTools for Node”.
To debug Node.js in Chrome DevTools, start Node with the --inspect or --inspect-brk flags. The command line terminal will display which ports are open for debugging. The default port is localhost:9229. After you’ve opened the dedicated DevTools, take note of the ports that are open for debugging. If your port is included, the debugger will attach itself, allowing you to view the source code and set breakpoints.
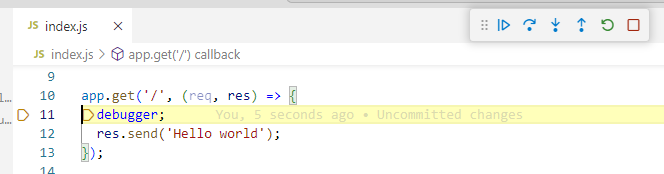
4. To force breakpoints, use the ‘debugger’ keyword
Often, you cannot see the source code and set breakpoints ahead of time. This could be due to the code being minimized, a lack of source maps, or any other reason why you cannot see the source code in the debugger. In those cases, you can use the debugger keyword to always break when a debugger is attached.
app.get('/', (req, res) => {
  debugger;
  res.send('Hello world');
});
When the process is not connected to a debugger, the runtime ignores this statement. When a debugger is attached, the program will break as if you had set a breakpoint.
Bottom Line
We discussed a variety of approaches to debugging Node.js programs. You learned how to attach to a Node process in Visual Studio Code, how to debug a process with F5, how to auto-attach to any Node code using the JavaScript Debugging Terminal, how to use the “Toggle Auto Attach” feature, and how to use Chrome’s dedicated DevTools for Node.
Knowing a variety of debugging techniques is useful. Most of the time, some of those options will be unavailable in your environment, so having some alternatives is beneficial. Also, I hope this helped you understand how Node debugging works both inside and outside of Visual Studio Code.


Javier is Content Specialist and also .NET developer. He writes helpful guides and articles, assist with other marketing and .NET community work